
How to Convert a Single HEX Color Code into a Monochrome Color Palette with Python
Spoiler: It’s harder than you think.
Colors are hard, especially if you don’t have an eye for design.
Most of us tech professionals don’t. The upside is that Python can do most of the heavy lifting for you. It can generate an entire monochromatic color palette that’ll look stunning on any stacked chart.
The downside is that getting there requires a fair bit of coding. You have to write custom functions to convert a color from HEX to HSL and vice versa, and figure out if the starting color is too bright, as well as how much lighter each next color should be.
Adding insult to injury, I haven’t found a single fully working Python library capable of accomplishing this task.
That’s where this article chimes in.
If you’re a subscriber to my Substack, you can skip the reading and download the notebook instead.
HEX, HSL, RGB — What’s With All The Jargon?
Let’s quickly cover three color formats you need to know:
- HEX — A six-digit code typically used in web development and graphic design. The color code starts with a #, followed by six hexadecimal digits. Pairs of two represent the amount of red, green, and blue. For example, #FF5633 - FF represents red, 56 represents green, and 33 represents blue. Values can range from 00 to FF in hexadecimal, or 0 to 255 in decimal.
- RGB — A color model that defines colors based on their red, green, and blue components. Each value ranges from 0 to 255. Different amounts of red, green, and blue are combined to produce a wide range of colors. It can be easily translated into HEX — just convert the RGB amounts into their hexadecimal representation.
- HSL — A cylindrical coordinate representation of colors. It describes colors based on hue, saturation, and lightness. Hue is the color itself represented as an angle on a color wheel (0 to 360 degrees with 0 degrees being red, 120 degrees being green, and 240 degrees being blue). Saturation represents the vividness of the color expressed in percentages (0–100%). And lightness represents how light or dark the color is (0% being black and 100% being white).
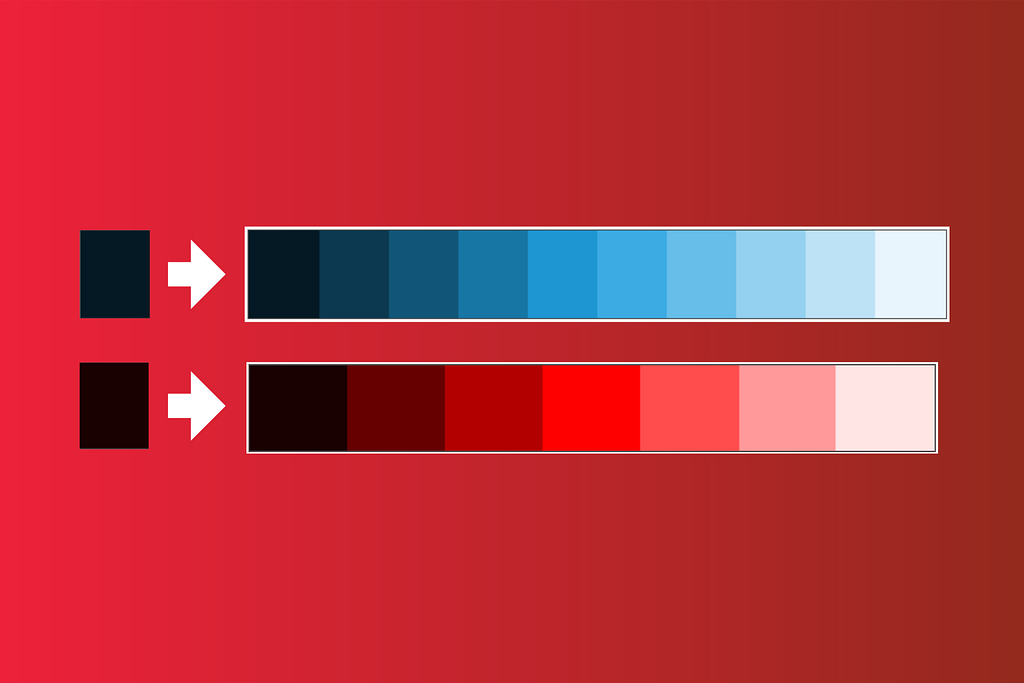
The process of creating a monochrome palette boils down to adjusting the Lightness of color in HSL format while keeping Hue and Saturation unchanged.
For a better idea, try any color wheel tool online. Enter a HEX code, and you’ll see its other color system versions:
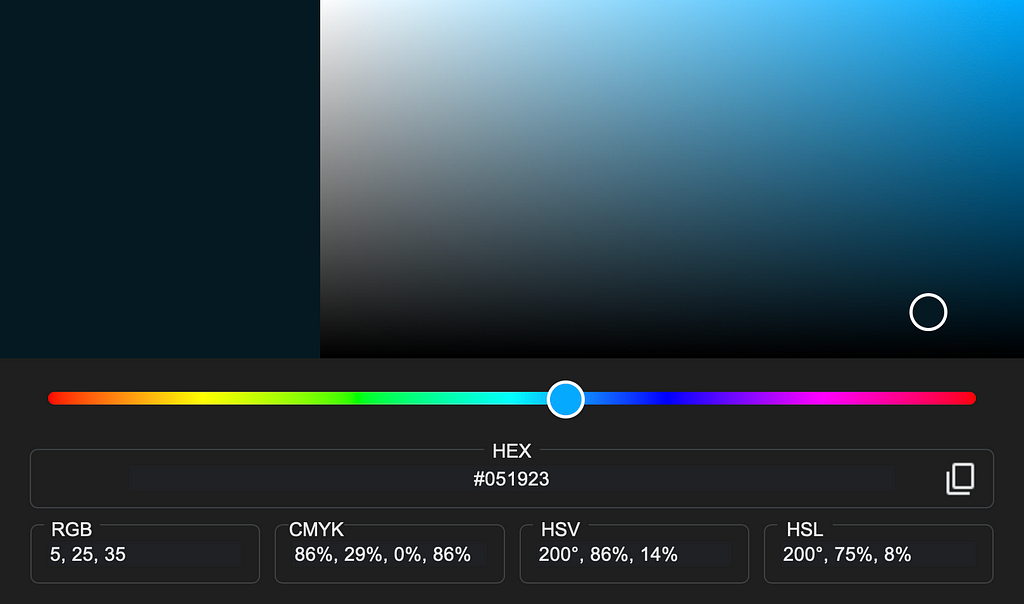
But to get there, you’ll have to convert a HEX color to RGB, RGB to HSL, get an array of colors with different lightness percentages, and then convert it back to HEX.
The problem is, some color codes can’t be converted 100% accurately, and will be estimated. That’s fine, as you’ll end up with a visually indistinguishable color with a slightly different HEX code.
Enough with the theory — let’s start coding!
How to Create a Monochrome Color Palette From Scratch
Start by importing the libraries:
import numpy as np
import pandas as pd
import matplotlib as mpl
import matplotlib.pyplot as plt
You can optionally use my custom Matplotlib theme to make the charts stand out without any manual tweaks:
mpl.style.use("custom_light.mplstyle")
Onto the code now.
The MonochromePaletteGenerator class implements the following methods:
- __init__() — A class constructor that initializes two attributes: MIN_ALLOWED_LIGHTNESS (integer set to 15 to ensure the palette does not start with too light a color) and max_palette_lightness (integer set to 95, it limits the lightness of the lightest color in the palette).
- __validate_starting_lightness() - Checks if the starting lightness value matches the range set in the constructor.
- hex_to_hxl() - Given a HEX color code it first converts it into RGB and then calculates lightness, saturation, and hue through a somewhat involved process.
- hsl_to_hex() - Given the values for hue, saturation, and lightness, the method estimates RGB values through primes and then converts them back to a HEX color code.
- __create_lightness_range() - A helper method that creates n_colors with linearly spaced lightness values for a monochrome color palette. You'll want to tweak this method to adjust the spacing between the colors (e.g., don't use linear spacing).
- create_hex_code_palette() - Given a starting HEX color code and a number of colors, it translates HEX to HSL, creates a lightness range, and converts a list of HSL colors into HEX format.
- create_matplotlib_palette() - Uses Matplotlib's mpl.colors.ListedColormap to create a color palette you can use in Matplotlib.
Here’s what it boils down to in the code:
class MonochromePaletteGenerator:
    def __init__(self, max_palette_lightness: int = 95):
        self.MIN_ALLOWED_LIGHTNESS = 15
        self.max_palette_lightness = max_palette_lightness

    def __validate_starting_lightness(self, starting_lightness: int) -> bool:
        if starting_lightness <= self.MIN_ALLOWED_LIGHTNESS:
            return True
        return False

    @staticmethod
    def hex_to_hsl(hex_color: str) -> tuple:
        # Remove the "#" character if present
        hex_color = hex_color.lstrip('#')

        # Convert hex to RGB
        r = int(hex_color[0:2], 16) / 255.0
        g = int(hex_color[2:4], 16) / 255.0
        b = int(hex_color[4:6], 16) / 255.0

        # Find the maximum and minimum RGB values
        max_val = max(r, g, b)
        min_val = min(r, g, b)
        delta = max_val - min_val

        # Calculate Lightness
        L = (max_val + min_val) / 2

        # Calculate Saturation
        if delta == 0:
            S = 0  # It's a shade of gray, so no saturation
            H = 0  # Hue is undefined for gray, but we can set it to 0
        else:
            if L < 0.5:
                S = delta / (max_val + min_val)
            else:
                S = delta / (2.0 - max_val - min_val)

            # Calculate Hue
            if max_val == r:
                H = ((g - b) / delta) % 6
            elif max_val == g:
                H = (b - r) / delta + 2
            elif max_val == b:
                H = (r - g) / delta + 4

            H *= 60  # Convert hue to degrees

            if H < 0:
                H += 360

        return int(round(H)), int(round(S * 100)), int(round(L * 100))

    @staticmethod
    def hsl_to_hex(h: int, s: int, l: int) -> str:
        # Convert the saturation and lightness percentages to a fraction of 1
        s /= 100
        l /= 100

        # Calculate C, X, and m
        C = (1 - abs(2 * l - 1)) * s  # Chroma
        X = C * (1 - abs((h / 60) % 2 - 1))  # Intermediate value based on hue
        m = l - C / 2  # Lightness adjustment

        # Calculate r', g', b' (primed values)
        if 0 <= h < 60:
            r_prime, g_prime, b_prime = C, X, 0
        elif 60 <= h < 120:
            r_prime, g_prime, b_prime = X, C, 0
        elif 120 <= h < 180:
            r_prime, g_prime, b_prime = 0, C, X
        elif 180 <= h < 240:
            r_prime, g_prime, b_prime = 0, X, C
        elif 240 <= h < 300:
            r_prime, g_prime, b_prime = X, 0, C
        elif 300 <= h < 360:
            r_prime, g_prime, b_prime = C, 0, X
        else:
            raise ValueError("Hue value must be in range [0, 360)")

        # Convert r', g', b' to the range [0, 255]
        r = round((r_prime + m) * 255)
        g = round((g_prime + m) * 255)
        b = round((b_prime + m) * 255)

        # Convert RGB to hex
        return "#{:02X}{:02X}{:02X}".format(r, g, b)

    def __create_lightness_range(self, starting_lightness: int, n_colors: int) -> list:
        # Make `n_colors` number of linearly spaced lightness values between thr provided starting color
        # and max allowed lightness
        spaced_values = np.linspace(starting_lightness, self.max_palette_lightness, n_colors)
        lightness = np.round(spaced_values).astype(int)
        return lightness

    def create_hex_code_palette(self, starting_hex: str, n_colors: int) -> list:
        # Convert HEX to HSL
        starting_hsl = self.hex_to_hsl(hex_color=starting_hex)
        # Check if HSL is valid
        is_valid_starting_hex = self.__validate_starting_lightness(starting_lightness=starting_hsl[2])

        # Proceed only if the starting HSL is valid
        if is_valid_starting_hex:
            palette = []
            lightness_range = self.__create_lightness_range(starting_lightness=starting_hsl[2], n_colors=n_colors)
            for lightness in lightness_range:
                # Keep hue and saturation identical
                h = starting_hsl[0]
                s = starting_hsl[1]
                # Only change the lightness
                curr_hex = self.hsl_to_hex(h=h, s=s, l=lightness)
                palette.append(curr_hex)

            return palette

        raise ValueError("Given starting color is too light to construct a palette. Please choose a darker shade.")

    @staticmethod
    def create_matplotlib_palette(colors: list, palette_name: str) -> mpl.colors.ListedColormap:
        return mpl.colors.ListedColormap(
            name=palette_name,
            colors=colors
        )
Up next, let’s see what goes into using this class.
How to Use the MonochromePaletteGenerator class
You can create an object from the class like you normally would:
palette_generator = MonochromePaletteGenerator()
No parameters are required, as max_palette_lightness has a default value.
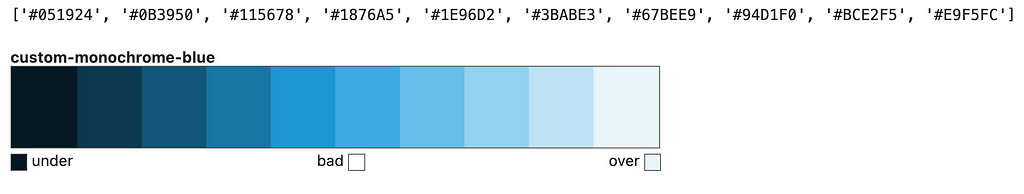
To create a blue monochrome palette, provide a dark enough starting hex color code and the number of colors. From there, you can also convert the generated palette into a Matplotlib format:
monochrome_blue = palette_generator.create_hex_code_palette(starting_hex="#051923", n_colors=10)
monochrome_blue_mpl = palette_generator.create_matplotlib_palette(colors=monochrome_blue, palette_name="custom-monochrome-blue")

print(monochrome_blue)
monochrome_blue_mpl
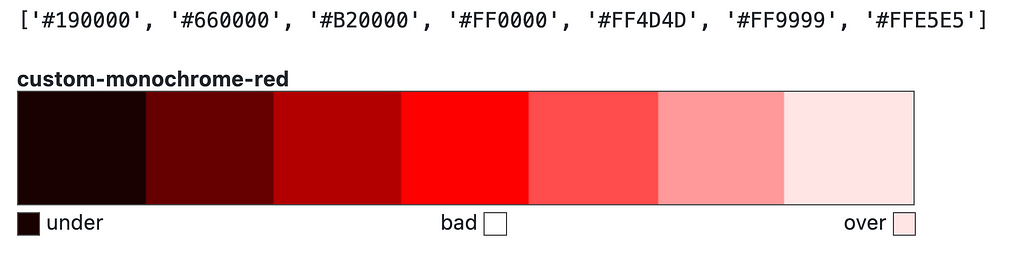
It works with other colors as well. For example, you can use the following snippet to create a monochrome red palette:
monochrome_red = palette_generator.create_hex_code_palette(starting_hex="#1c0000", n_colors=7)
monochrome_red_mpl = palette_generator.create_matplotlib_palette(colors=monochrome_red, palette_name="custom-monochrome-red")

print(monochrome_red)
monochrome_red_mpl
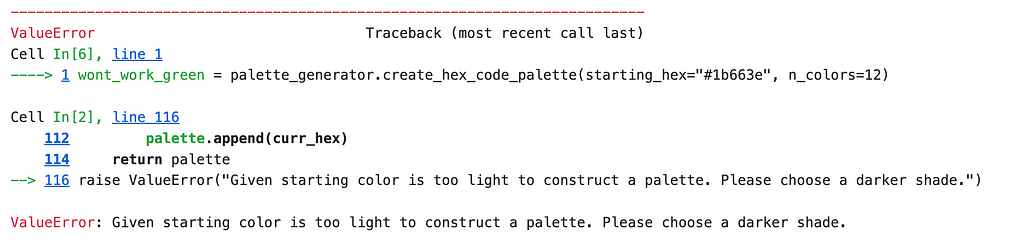
The create_hex_code_palette() will fail if the starting color is too bright, as you can see from the following example:
wont_work_green = palette_generator.create_hex_code_palette(starting_hex="#1b663e", n_colors=12)
The best way to see your color palettes in action is with charts.
Monochrome Color Palettes in Action
Use the following snippet to create a made-up dataset of employee counts per location and department:
df = pd.DataFrame({
    "HR": [50, 63, 40, 68, 35],
    "Engineering": [77, 85, 62, 89, 58],
    "Marketing": [50, 35, 79, 43, 67],
    "Sales": [59, 62, 33, 77, 72],
    "Customer Service": [31, 34, 61, 70, 39],
    "Distribution": [35, 21, 66, 90, 31],
    "Logistics": [50, 54, 13, 71, 32],
    "Production": [22, 51, 54, 28, 40],
    "Maintenance": [50, 32, 61, 69, 50],
    "Quality Control": [20, 21, 88, 89, 39]
}, index=["New York", "San Francisco", "Los Angeles", "Chicago", "Miami"])

df = df.T
df = df.loc[df.sum(axis=1).sort_values().index]

df
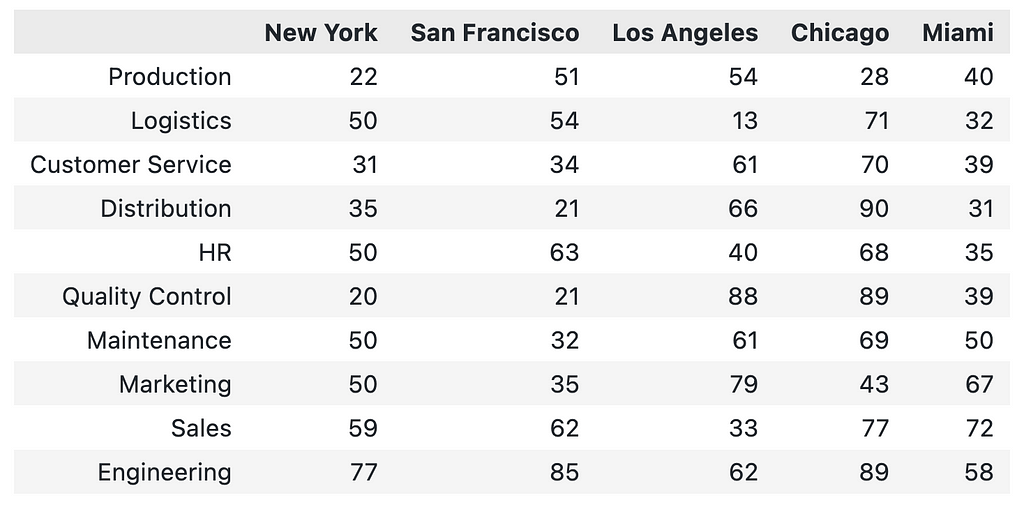
There are 5 office locations and 10 departments — an ideal situation for a stacked horizontal bar chart!
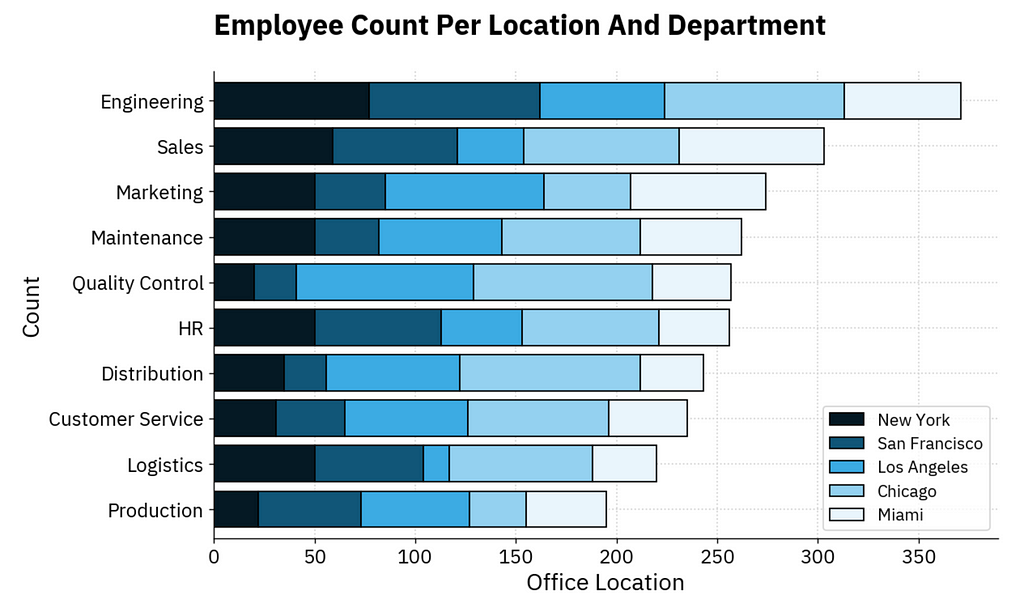
You can pass your custom color palette to the colormap parameter:
ax = df.plot(kind="barh", colormap=monochrome_blue_mpl, width=0.8, edgecolor="#000000", stacked=True)

plt.title("Employee Count Per Location And Department", loc="left", fontdict={"weight": "bold"}, y=1.06)
plt.xlabel("Office Location")
plt.ylabel("Count")

plt.show()
The same code works with the monochrome red palette — just change the colormap value:
ax = df.plot(kind="barh", colormap=monochrome_red_mpl, width=0.8, edgecolor="#000000", stacked=True)

plt.title("Employee Count Per Location And Department", loc="left", fontdict={"weight": "bold"}, y=1.06)
plt.xlabel("Office Location")
plt.ylabel("Count")

plt.show()
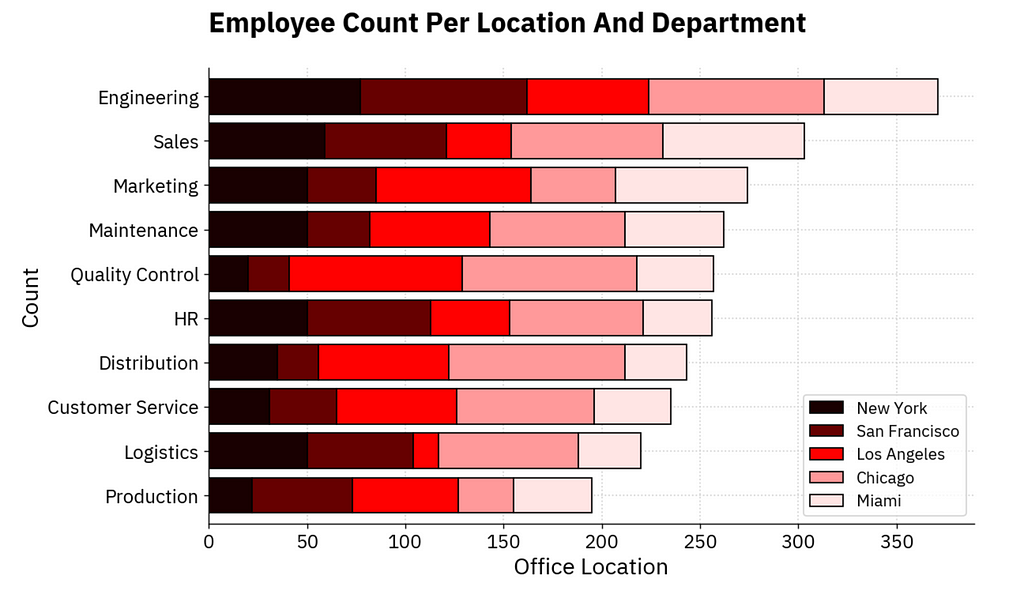
Long story short — it works like a charm — it just needs a dark enough color to start.
Wrapping up
To conclude, a bit of Python code can go a long way.
Usually, to create a monochrome color palette, you’d search online or start with a color you like and adjust the lightness until you get enough variations. Today, you’ve learned how to automate this process.
You can expand this by adding default starting colors, so you don’t need to choose one each time. But that part is simple and I’ll leave it to you.
Until next time.
-Dario
Data Doodles with Python | Dario Radecic | Substack
Originally published at https://darioradecic.substack.com.
How to Convert a Single HEX Color Code into a Monochrome Color Palette with Python was originally published in Towards Data Science on Medium, where people are continuing the conversation by highlighting and responding to this story.
from Datascience in Towards Data Science on Medium https://ift.tt/cCay1lM
via IFTTT


