
Simulate the Challenges of a Circular Economy for Fashion Retail
Use data analytics to simulate a circular rental model for fashion retail and understand store operations and logistics challenges.
The concept of a circular economy includes models aiming to reduce waste and improve resource efficiency.
Some fashion retailers have implemented a subscription model with customers paying a regular fee to rent a product for a specific period.
Have you ever considered renting your clothes?
In a previous article, I used data analytics to simulate this rental model using an example of a Fashion retailer with ten stores.
The objective was to estimate the environmental performance, i.e., reducing CO2 emissions and water usage.
However, logistic operations will face additional challenges in collecting and processing rented items to support this transition.
As a data scientist, can you assess the operational challenges of implementing this model?
This article will use data analytics to estimate these challenges and understand which metrics are crucial to redesigning the logistic network.
The aim is to help sustainability and logistics teams build a solid business case (with ROI and risk assessment) to get the green light from top management for the transition to a circular economy.
Summary
I. Implement a Circular Model for Fashion Retail
  1. Problem Statement: Sustainability Roadmap of a Fashion Retailer
  A fashion retailer would like to implement a rental model in 10 stores
  2. Introduction of the Rental Model
  Simulation of the impact of this model on CO2 emission and water usage
  3. How do we implement these processes?
  Use analytics to derive the metrics needed to design logistics solutions
II. Data Analytics to Monitor a Rental Circular Model
Focus on each leg of the distribution network to collect KPIs
  1. Focus on the store operations
  Manage daily transactions per type (linear, circular)
  2. Focus on warehouse operations
  Impact on the upstream and downstream flows
  3. Focus on transportation management
  Organisation routing for returned items collection
III. Support the transition to a circular model with data analytics
  1. Business Intelligence for operational monitoring
  Collect, process and harmonize data from multiple systems
  2. Advanced Workforce Planning for Store Operations with Python
  Optimize the number of staff recruited at stores
  3. Return Flow Optimization with Python
  Allocation of the collection centers for returns
  4. Measure Scope 3 Emissions of your Distribution Network
  Measure the CO2 emissions impact of your collection routes
IV. Conclusion
Implement a Circular Model for Fashion Retail
Problem Statement: Sustainability Roadmap of a Fashion Retailer
You are the Data Science Manager in the Supply Chain department of an international fashion retail group.
Your CEO publicly announced last year the company’s commitment to supporting the United Nations Sustainable Development Goals (SDGs).
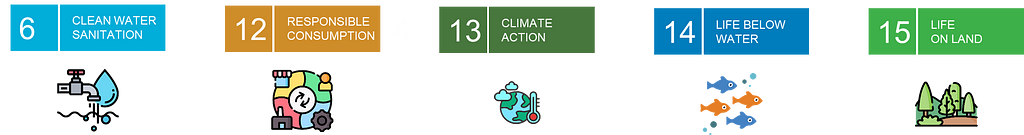
As part of this commitment, the company aims to reduce its environmental footprint along its entire value chain.
As a data scientist, how can you support this transformation?
You focus on assisting the sustainability and logistics teams in assessing and designing solutions to implement a circular rental model.
This initiative began with a study involving ten stores for a total of 400 unique items.
What is the conclusion?
The results demonstrated that shorter rental periods maximize the efficiency of the circular model.
However, this study only focused on the environmental benefits without considering the operational challenges that stores and logistics teams face.
What are the impact on the logistic budget?
The teams must justify the return on investment (ROI) and estimate the budget before receiving approval from the top management.
Therefore, we will shift the attention to the operational side and use data analytics to estimate the additional workload at each stage of the distribution network.
Let me first briefly introduce the rental model.
Introduction of the Rental Model
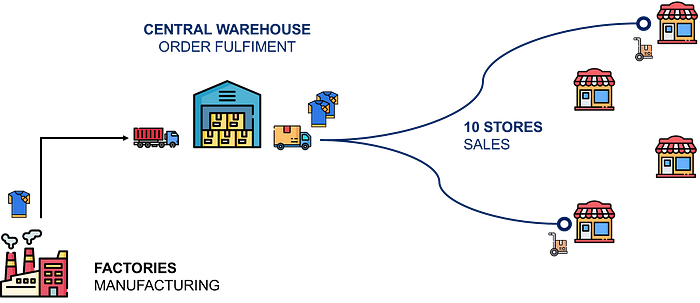
To reduce the environmental impact of its supply chain, your company experimented with a circular rental model in 10 stores.
These locations would propose a rental subscription model to their customers for a limited scope of 400 items.
Before implementing this service, logistics and sustainability teams requested support in simulating the processes to handle these additional flows.
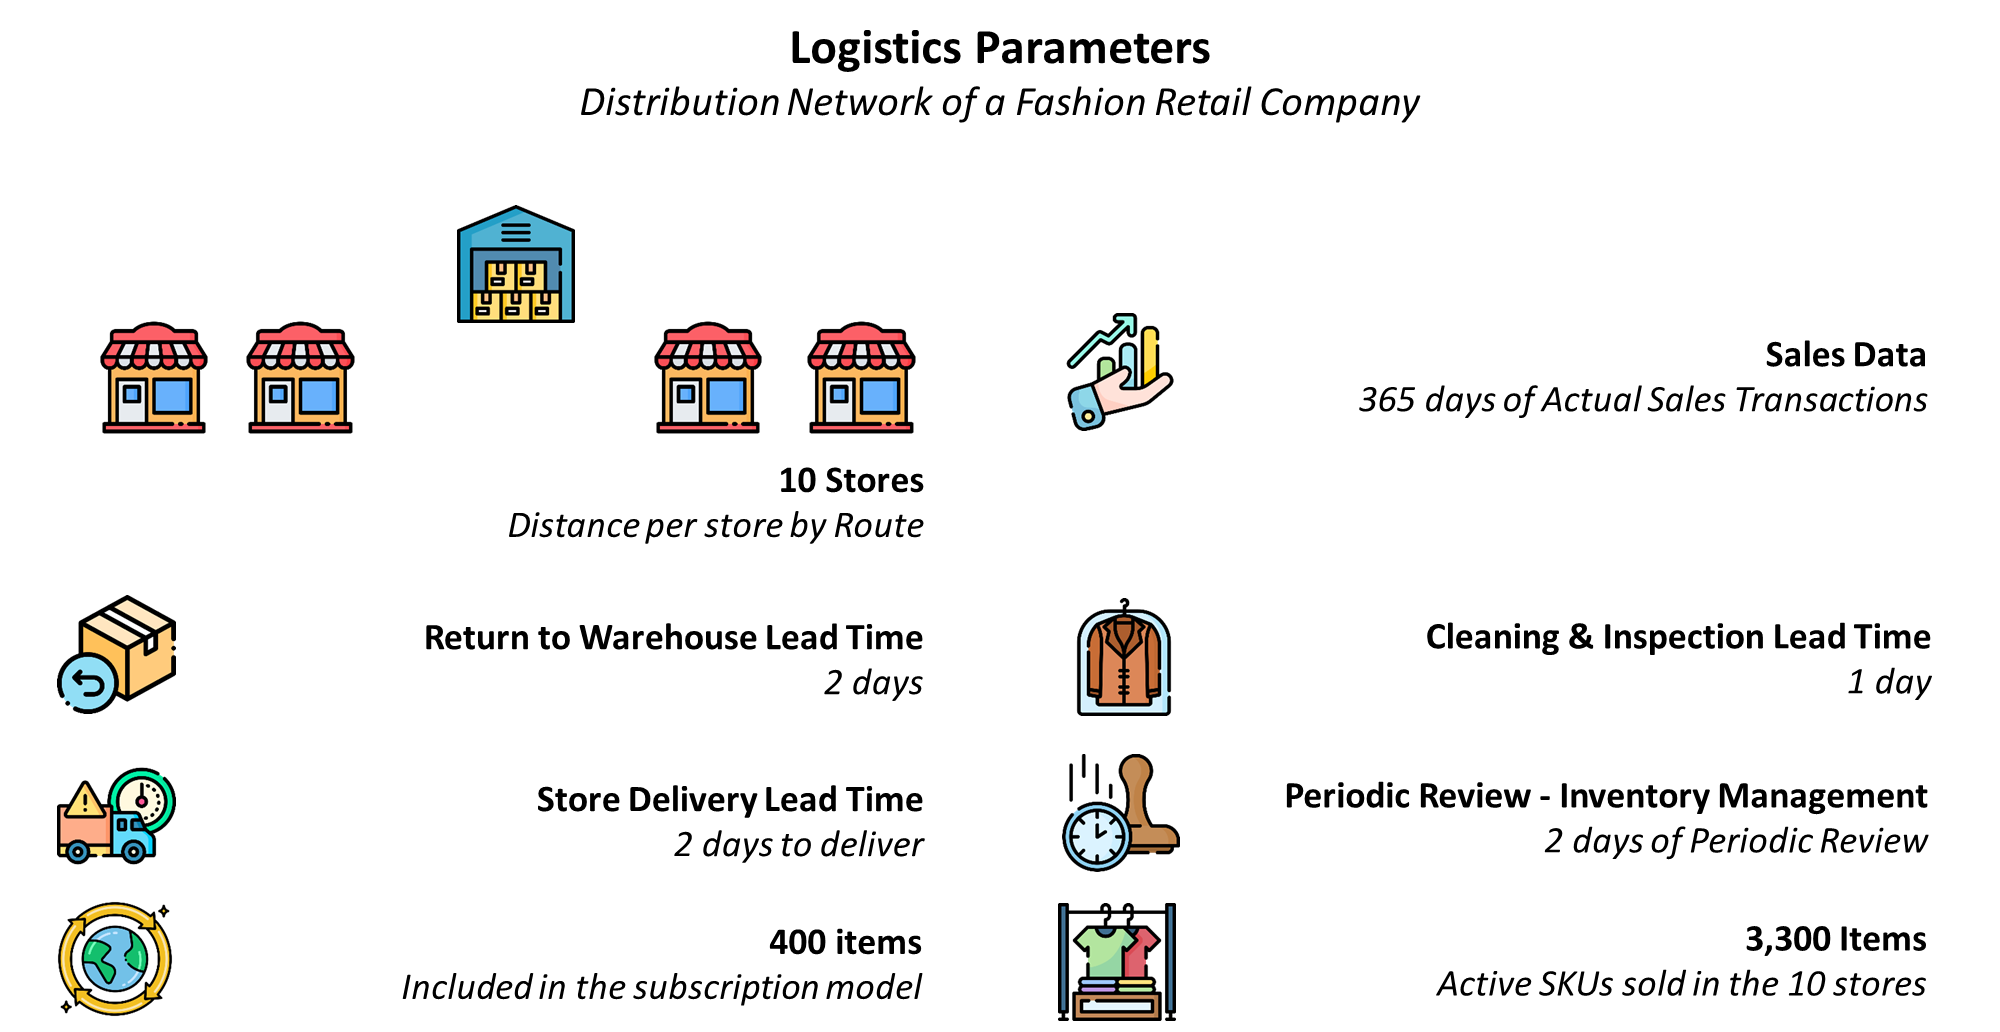
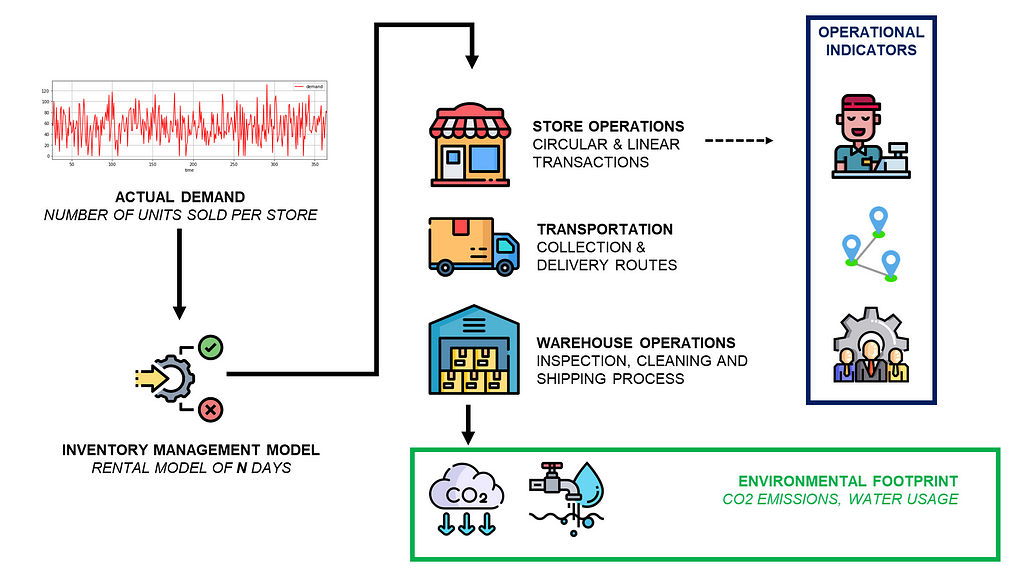
As input data, we used actual sales transactions, as shown below.
The simulations are covering ten stores for a period of 365 days.
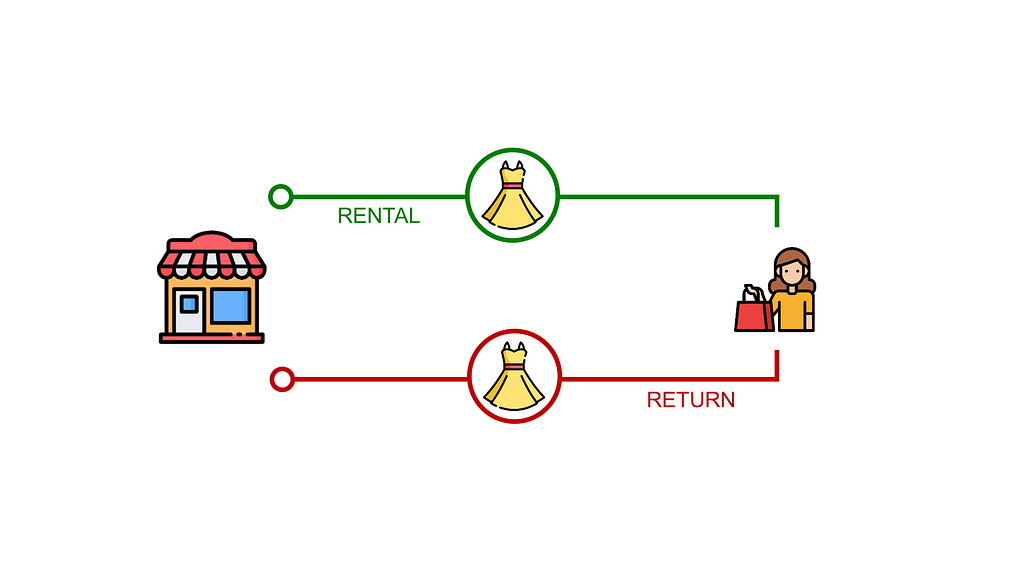
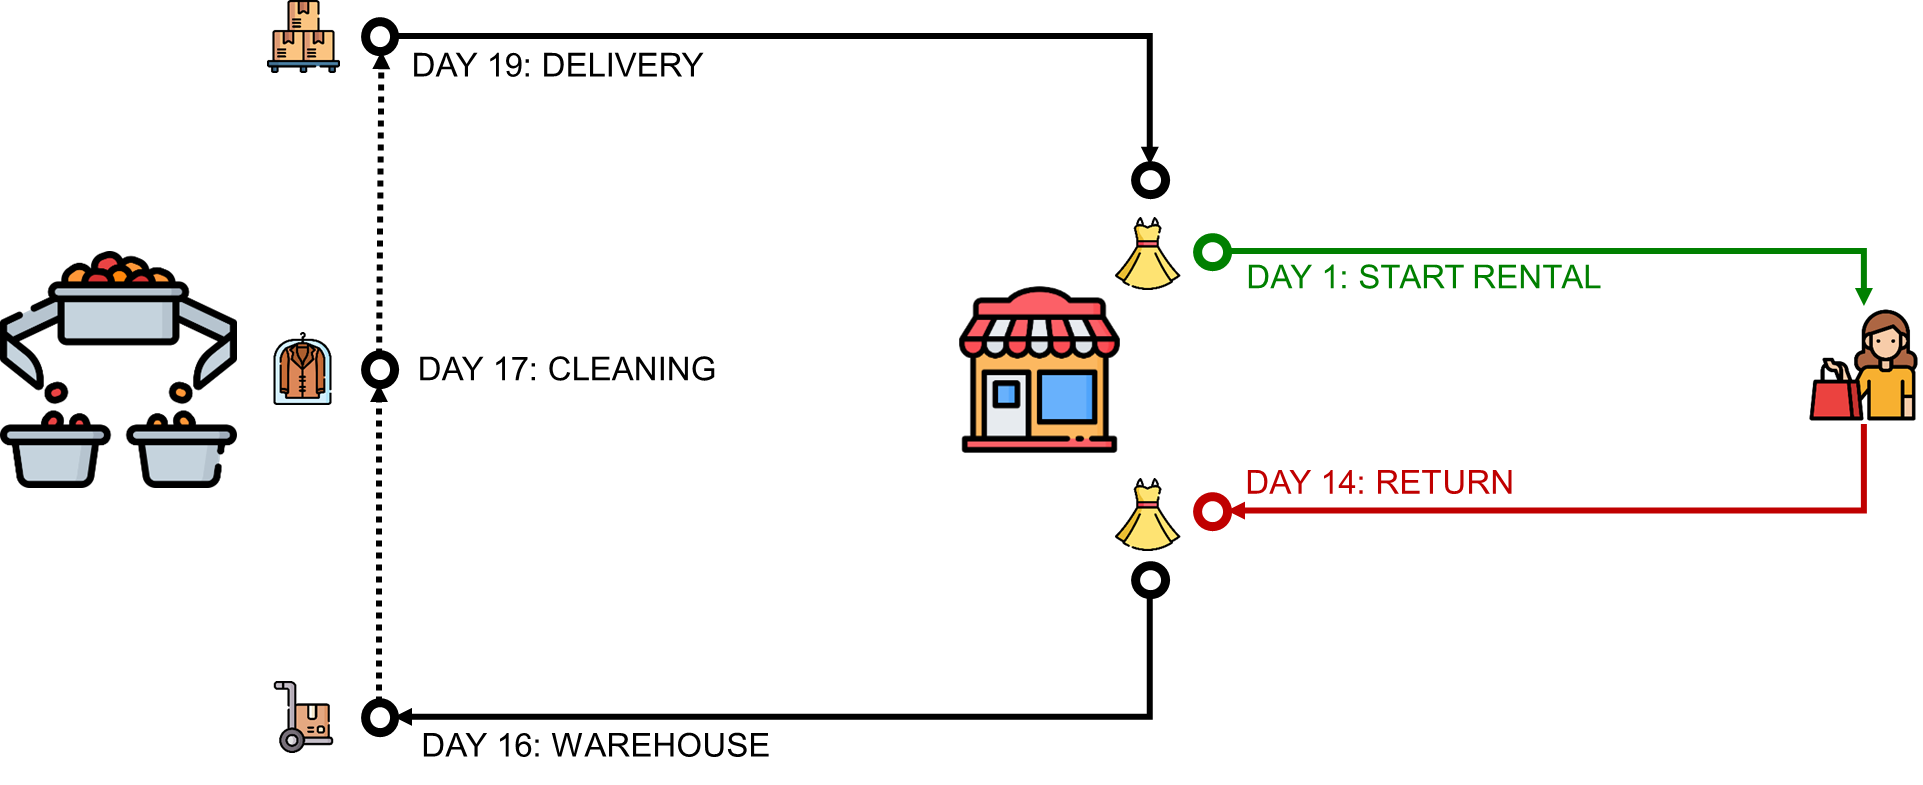
We assumed these “sales transactions” were “rental transactions”, meaning the customer goes to the store to rent a specific item for n days.
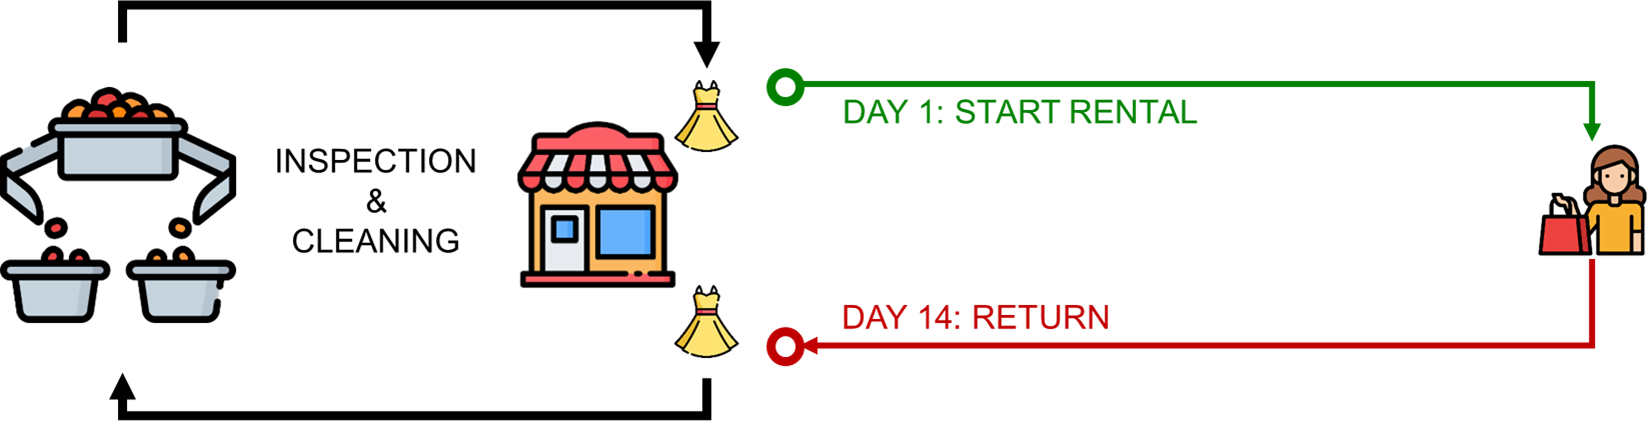
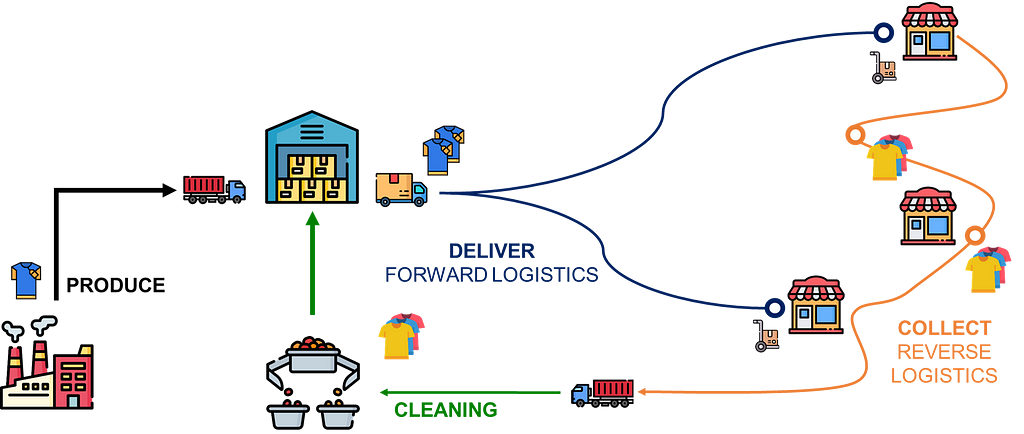
After the rental period ends, customers return the items to the store
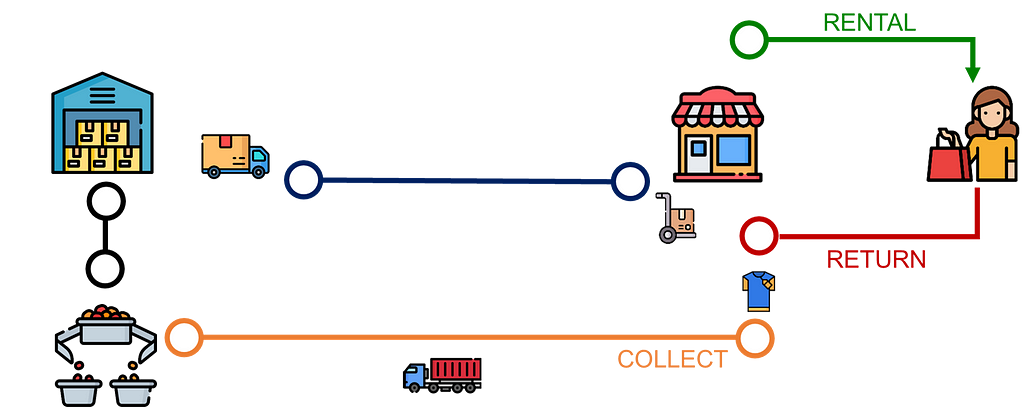
- It takes two days to have these items collected from the stores.
- They go through inspection and cleaning at the warehouse for one day.
- It takes another day to have the cleaned items delivered to stores.
How do we manage the flows rented items?
We apply the First-In, First-out (FIFO) principle to manage these flows
- After return and sorting, items are available at the warehouse
- The first store to order will be replenished with the first items returned
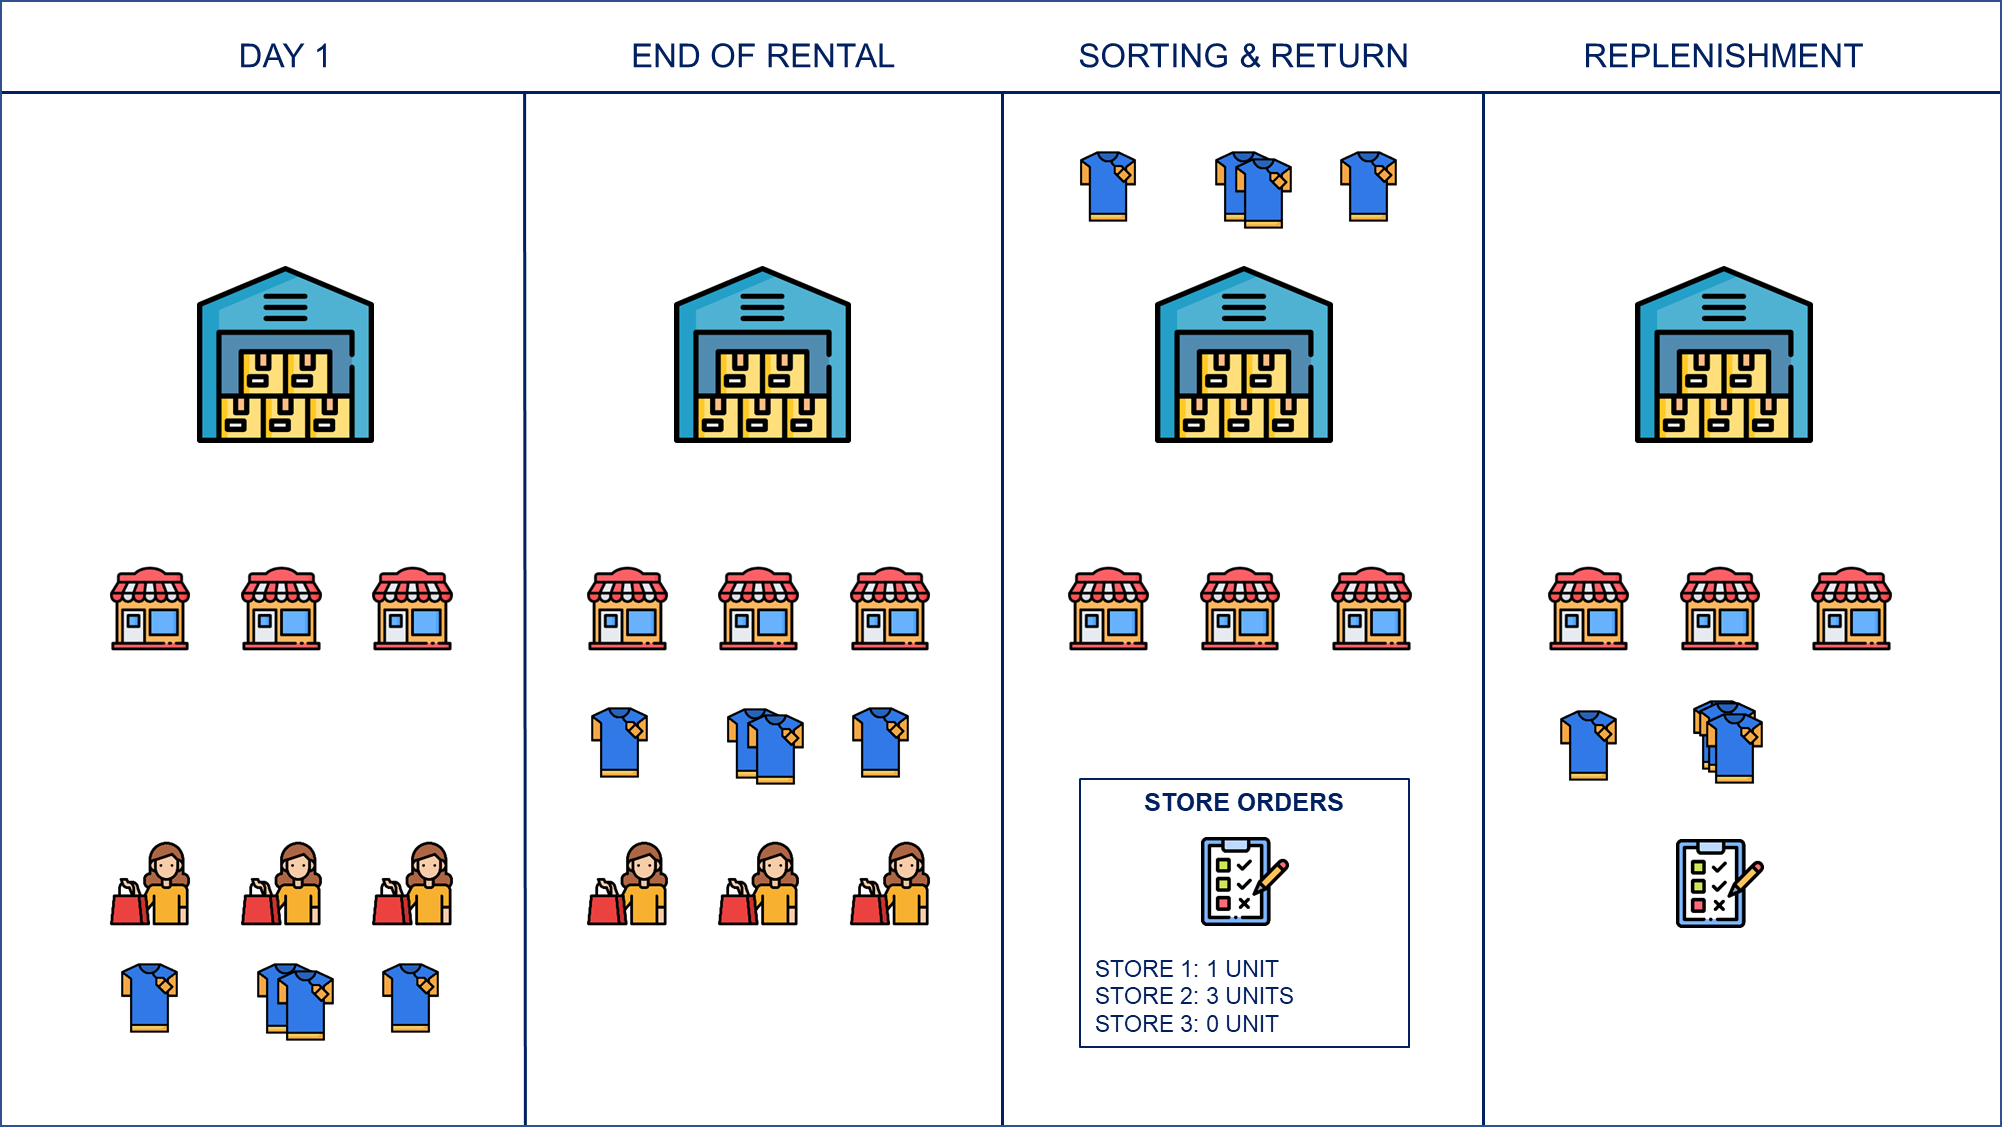
When a customer requests a specific item, we have two scenarios:
- Circular Transaction: the store will rent out returned clothes if there is sufficient inventory.
- Linear Transaction: The store will rent a new item if no returned items are available.
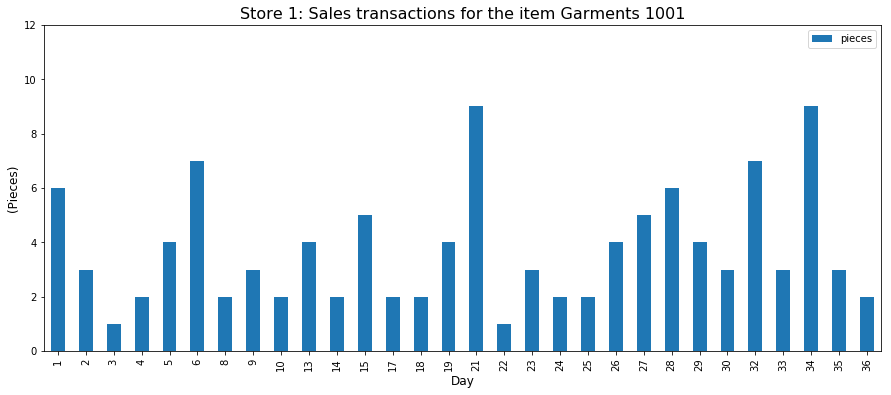
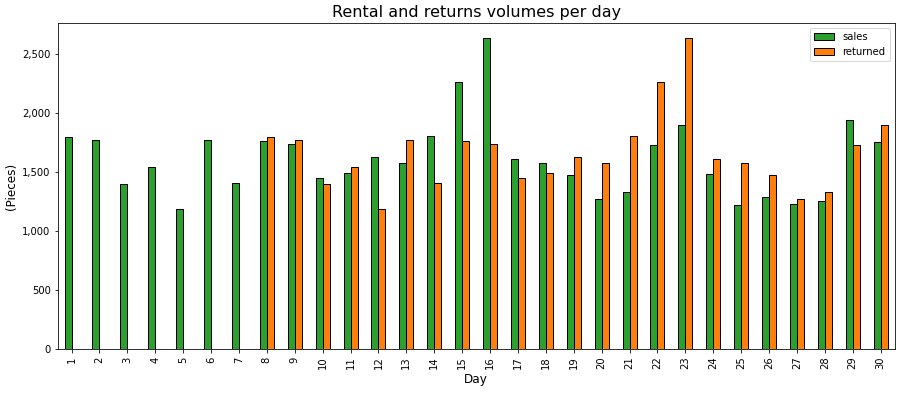
How does it look like for a specific store?
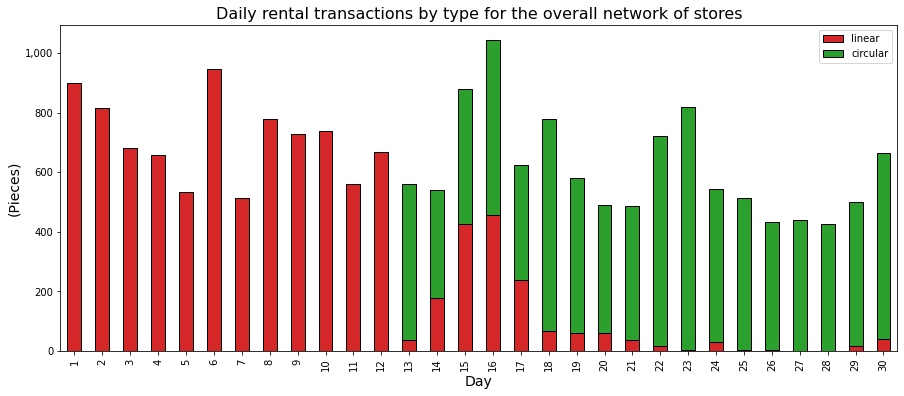
In the chart below, you visualize the volume of items rented daily with the split between linear (new items) and circular (returned items) transactions.
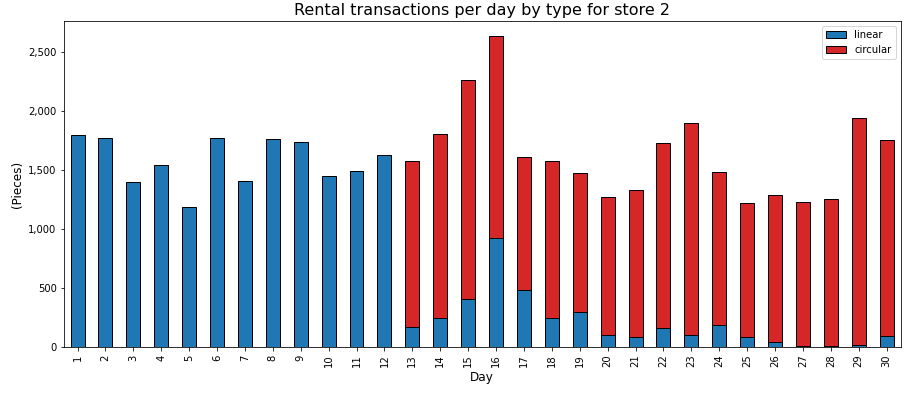
As you can see, the circular model starts on day 13 after the first rented items are returned (and cleaned).
Which metric do we want to estimate?
The focus was on measuring the model's environmental performance using several scenarios with different rental periods (2, 7, 14, and 28 days).
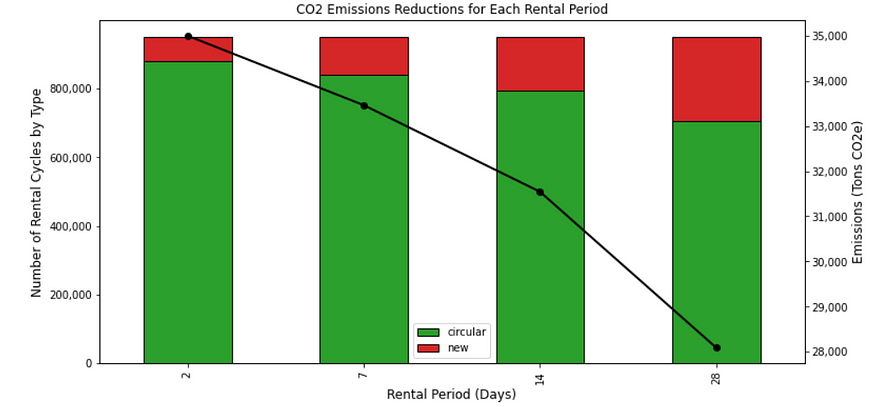
For each scenario, we calculate the percentage of circular transactions (items reused) and the impact on CO2 emissions reductions.
Sustainability Team: We can reach the highest footprint reduction with short rental periods.
For more details, have a look at this article
Data Science for Sustainability — Simulate a Circular Economy
From a sustainability point of view, this is a very insightful study.
However, it does not cover the impact on the distribution chain.
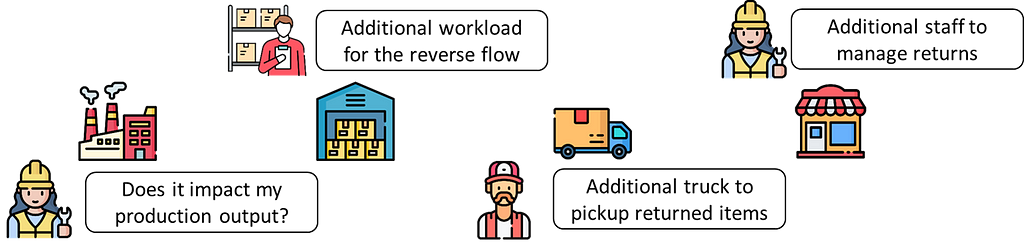
What about the operational challenges?
As a supply chain professional, I want to know how to include this operation in the current distribution model.
- Implementing short rental periods means having a high frequency of item rotation.
- Can we organise the collection with the same fleet that delivers stores?
- What about the additional workload at the warehouse for sorting and cleaning?
Let’s use data analytics to answer these questions.
How do we implement these processes?
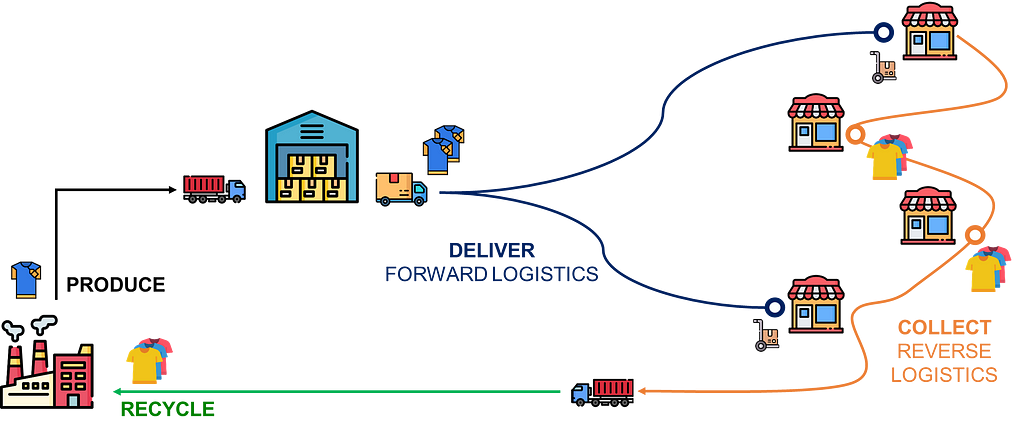
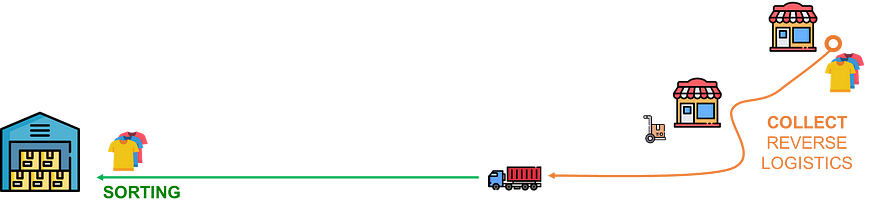
As a former Supply Chain Solution Designer, my approach starts by collecting the metrics needed to design the transportation and warehouse solutions for these reverse flows.
These solutions should cover
- The collection of returned items from stores with electric trucks. Question: How many trucks are needed to collect items every day?
- Receive and process items in the warehouse.
Question: How many operators are needed to receive and process items in the warehouse? - Deliver the cleaned (returned) items back to the stores.
Question: How many trucks are needed to manage these deliveries?
In the following section, we will cover the main metrics needed to assess the additional workload on your distribution network.
Data Analytics to Monitor the Logistics Network for a Rental Circular Model
Let us now explore the simulation model from a logistic point of view focusing on the goods flows.
We will assume that the rental period is seven days.
First, we can monitor the rental transactions at the stores and the impact on returned items.
What happens at the stores?
Focus on the store operations: daily transactions per type
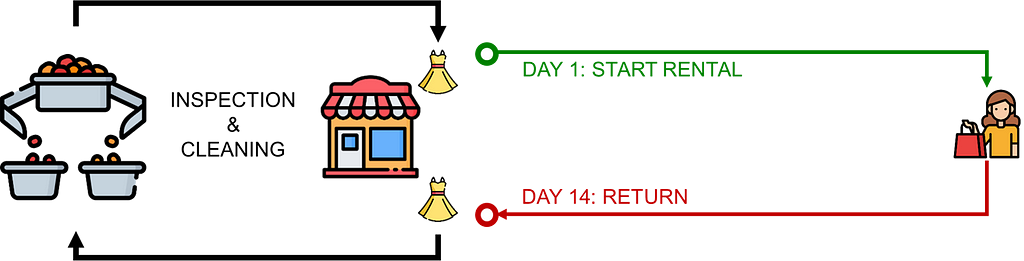
The circular model starts on day 1
- 100% of the items rented are new ;
- These items will be returned on day 8 to start a process of collection, processing and delivery, ending on day 13 ;
From day 13, the store will receive returned items and be ready to start the second rental cycle.
What are the impacts for the store teams?
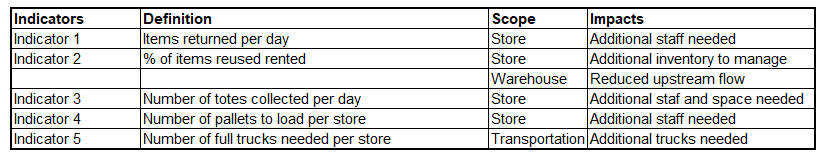
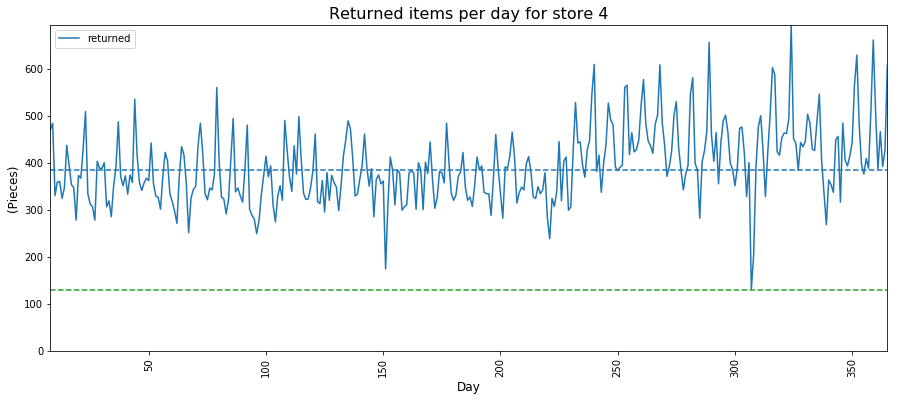
💡 Indicator 1: Number of items returned per day
From day 8, the store teams will have to manage the returned items
- Customers will queue at a dedicated area for the rental transactions
- Sales agents will receive these items
They will follow this standard procedure
- They should check if there is any damage to the returned item
- Record the return in the system and provide a receipt to the customer
- Transfert the item in the staging area to wait for collection
Can we assess the additional workload?
Let's do rough estimations assuming that the overall procedure takes 6 minutes on average and that we have 1.25 pieces per return transaction.
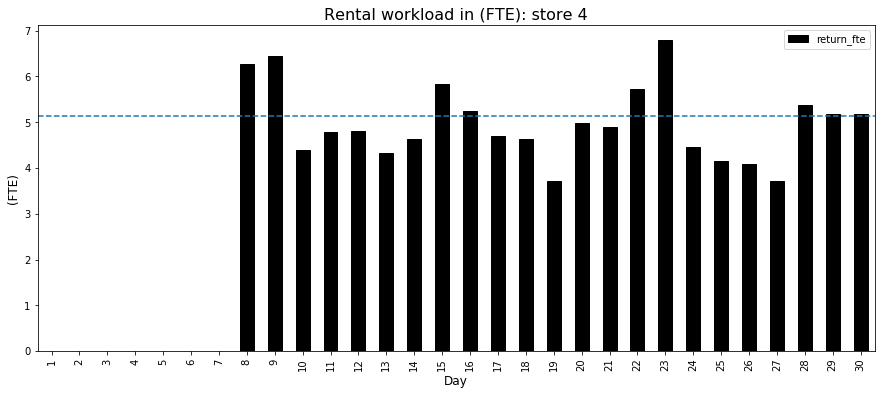
Starting from the first collection day (Day 8), we would need an average of 5.13 FTE for store 4.
How much does a FTE cost at your store?
This information is critical for store operational teams that have to manage the P&L of their sales locations.
💡 Indicator 2: % of items reused rented
From Day 13, the percentage of circular rentals exploded as expected.
The loop started with an inventory of rented items built that can be used to avoid using new items.
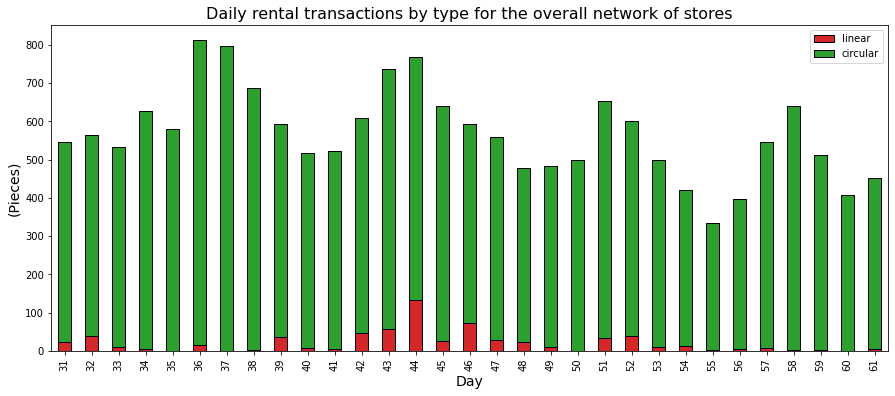
From the second month, less than 12% of new items (linear transactions) are used for rental transactions.
Focus on warehouse operations: upstream and downstream flows
What does that mean from a logistics point of view?
- The inventory of new items coming from the factory should be reduced, requiring less storage space in the warehouse.
- Reduction of the volume of replenishments from the factory: fewer trucks allocated to the upstream flow.
Unfortunately, the additional workload in the reverse flow will probably not be compensated by the reduction in the upstream flow.
What about the volume of pickup of returned items?
💡 Indicator 3: number of totes collected per day
Collected items are stored in plastic totes (10 pieces per tote) with fixed dimensions.
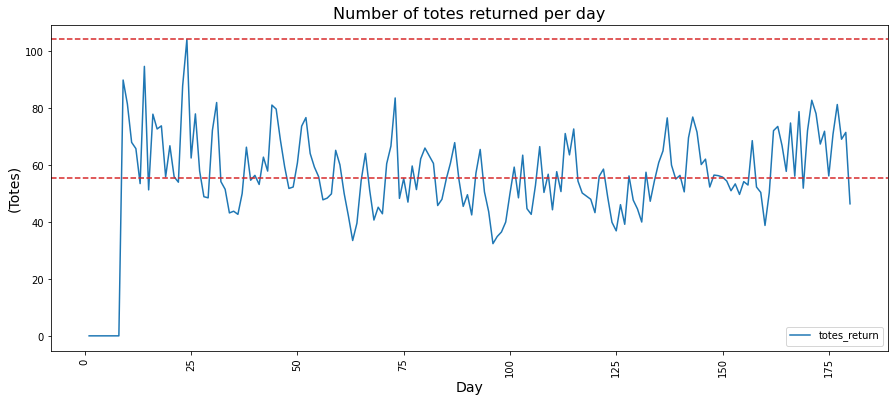
We have an average of 56 totes collected daily, with a peak of 105 totes for day 25.
🏪 What is the impact on store operations?
- We need to allocate storage locations for up to 210 totes.
💡 Do we have additional space for these totes? - There is a workload linked to the management of these 56 totes.
💡 Do we have enough staff to manage this internal logistics?
Now that we have returned items in totes, let’s focus on the collection process.
What parameters do we have on hand to design collection routes?
Focus on transportation management.
We need to analyze the daily volumes to collect per store to plan the collection routes.
The transportation teams will use trucks with a maximum capacity of pallets; these trucks can be collected from different stores.
💡 Indicator 4: number of pallets to load per store
Totes are loaded on pallets with a maximum capacity of 25 totes per pallet.
The stores are located in three areas: Area A, with four stores, and Area B and Area C, with three stores each.
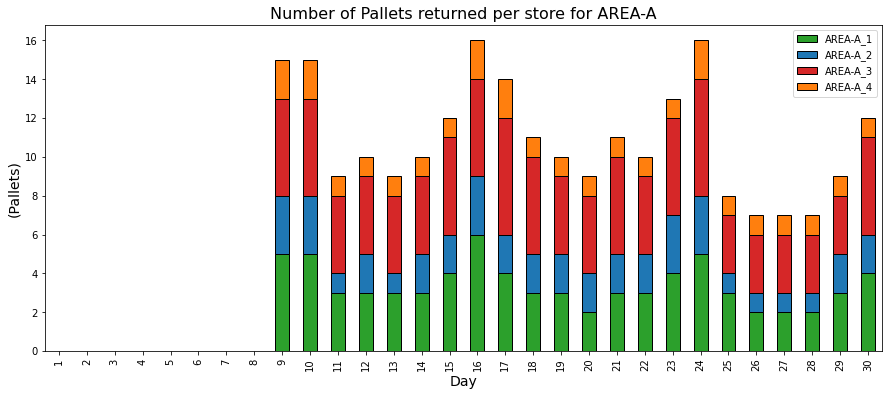
The stores of each area can share the same truck to collect pallets of returned items.
Let us convert these volumes in Full Truck Loads.
💡 Indicator 5: Number of full trucks needed per store
The transportation teams allocated trucks with a capacity of 14 pallets.
How many trucks do we need per store?
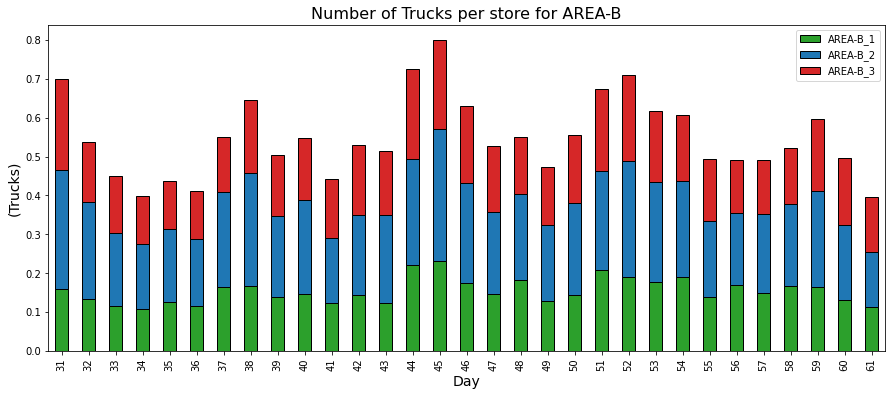
As you can observe, you cannot fill a truck by collecting only a single store in Area B.
- Transportation planners must organize routes with several collection points to maximize the usage of trucks.
- Based on past rental transactions, they can forecast the volumes of returns to create optimal routes.
These five indicators help supply chain engineers foresee future challenges and estimate additional costs.
Can we use data analytics to limit the impact on performance and cost efficiency?
Support the transition to a circular model with data analytics.
Let us assume that the top management has validated the proposal.
They agreed to implement a one-year pilot phase with the same scope as the study (10 stores, 400 items).
As a data analytics expert, how can you help operational and sustainability overcome the challenges listed before?
We will first focus on implementing descriptive analytics solutions to provide visibility to stores, warehouse and transportation teams.
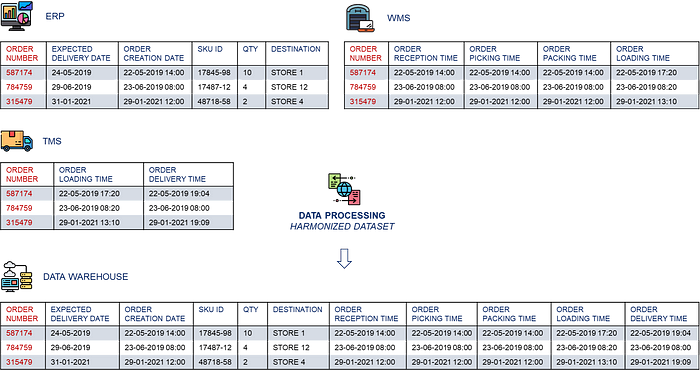
Business Intelligence for operational monitoring
Multiple systems are used to manage flows and inventories or update statuses along the value chain of your rented items.
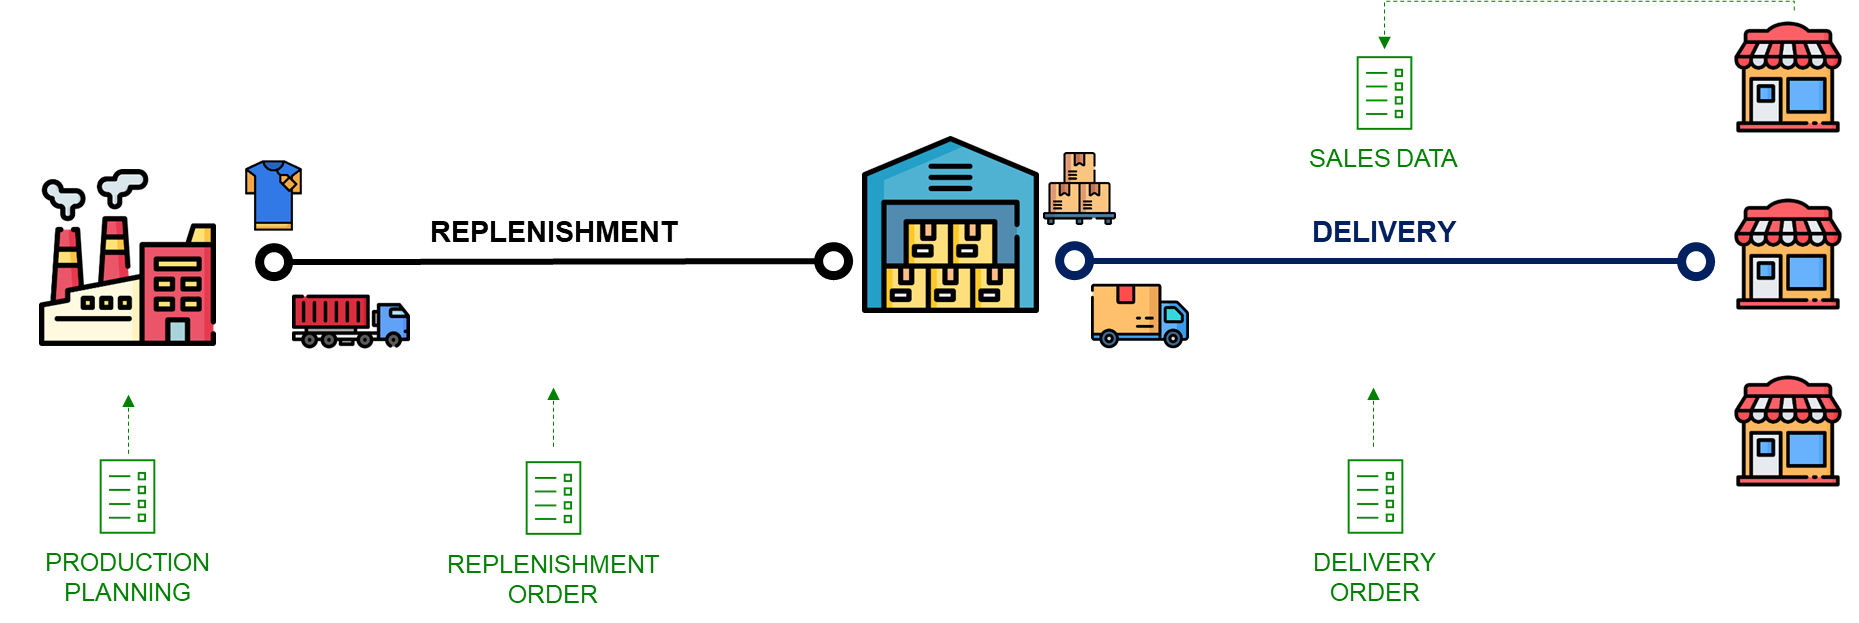
These systems create transactional data that could be used to monitor flows and collect the indicators mentioned previously.
- Transportation Management Systems (TMS) will track store deliveries and the pickup of returned items.
- Warehouse Management Systems can provide visibility of inbound flows from factories, the inventory and store deliveries or returns.
- Point of Sales (POS) and Enterprise Ressource Planning (ERP) will store the sales transactional data and the inventory of linear and circular items.
As an analytics expert, your role will be implementing automated pipelines to build a trusted source of harmonized data.
If you need an example of similar solutions, have a look at this article
What is Business Intelligence?
These clean datasets can be used for reporting purposes and as a source for more advanced prescriptive analytics solutions.
Advanced Workforce Planning for Store Operations with Python
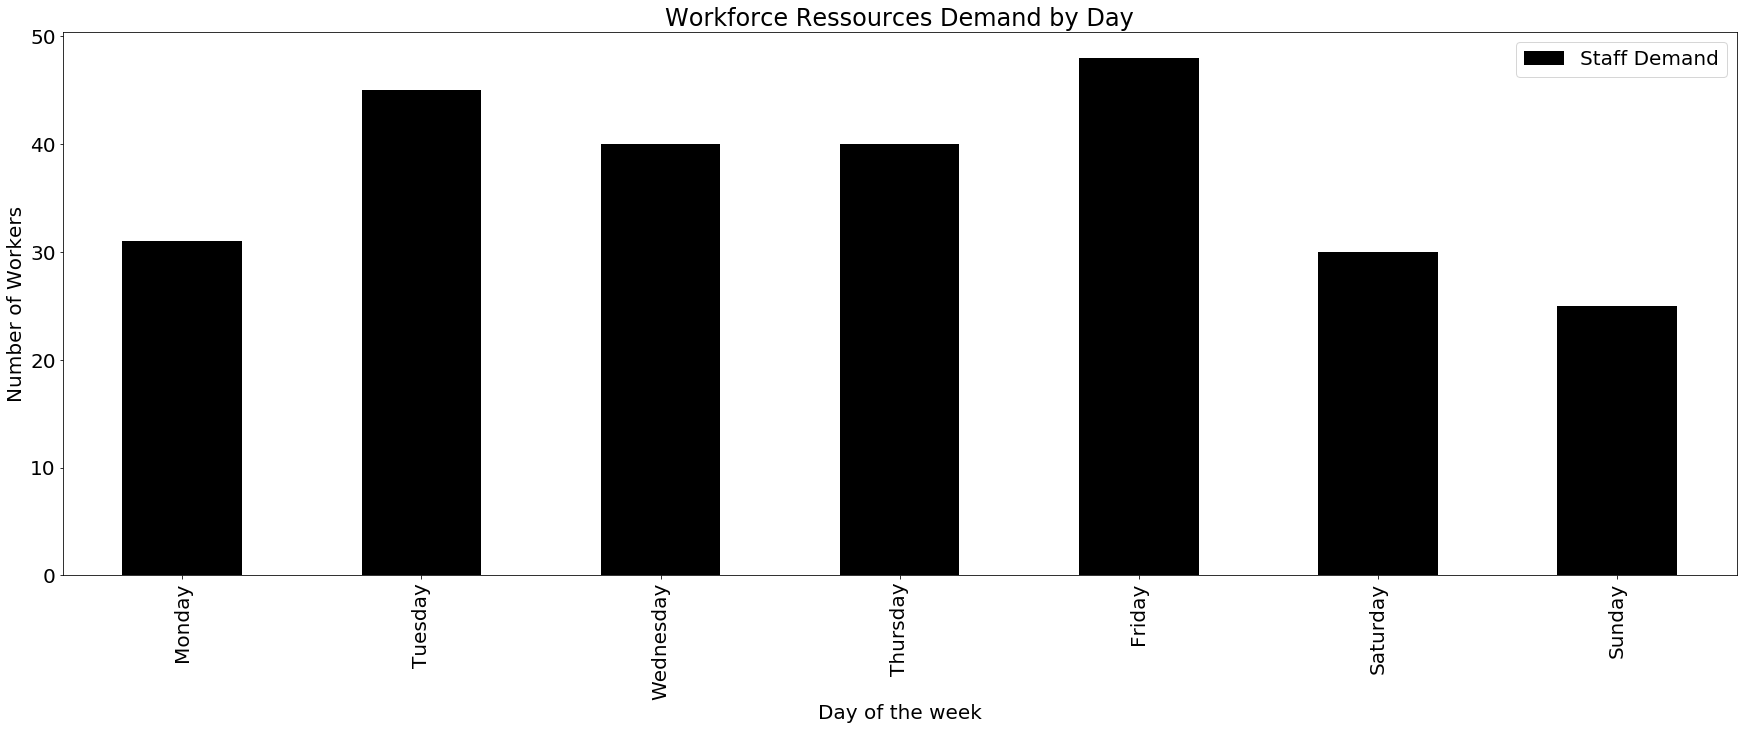
As illustrated by indicator 1 and indicator 4, the first challenge that store operations will face is the additional workload due to returns.
Thanks to the analytics solutions you implemented, you can visualize the past workload per day.
How many additional staff do we need to recruit to absorb the workload?
You would like to minimize the number of staff to recruit to save costs while respecting some constraints.
- Returns need to be processed on time ;
- Respect of the local regulations in terms of maximum working time ;
- Provide a minimum working time to attract candidates ;
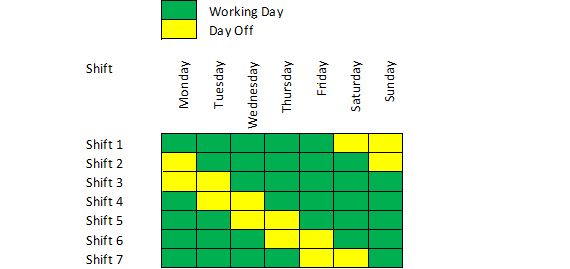
Fortunately, I have solved a similar issue for a warehouse’s inbound operations using linear programming with Python.
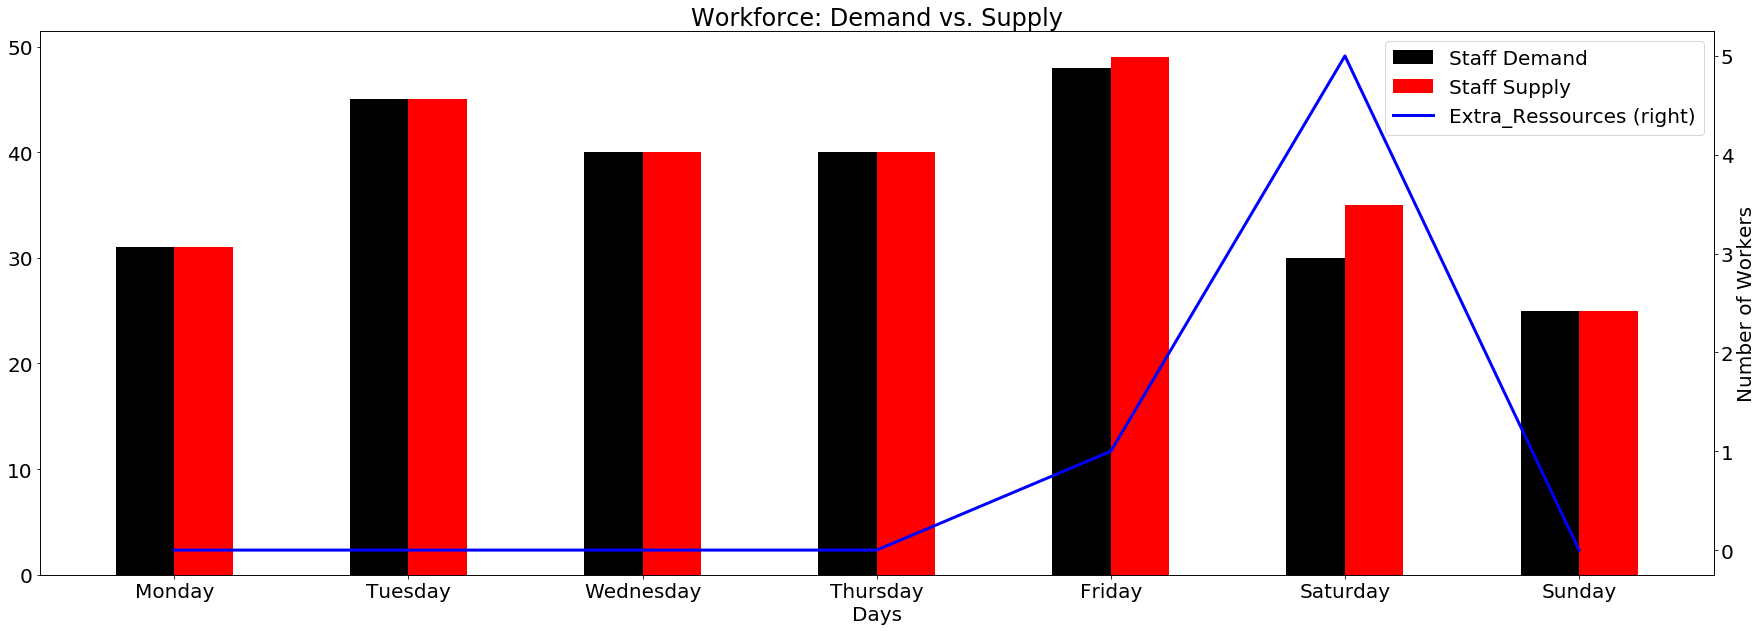
The idea is to use the Python library PuLP to build your model with an objective function (minimize staff) and different constraints.
After feeding your algorithm with volume forecasts, you can automatically generate the optimal number of staff to recruit per day.
For more details, look at the example detailed in this article.
Optimize Workforce Planning using Linear Programming with Python
However, we still have to deal with the transportation operations to collect these totes.
We must implement an optimal solution as this will represent the highest costs and environmental impact.
Return Flow Optimization with Python
The logistics department team requests your support in efficiently managing totes pickup at stores.
Considering the locations and capacity of the sorting centres, they would like an automated tool to allocate the right sorting centre to each store.
- Minimizing transportation costs and emissions for collection
- Respecting lead times and sorting capacities
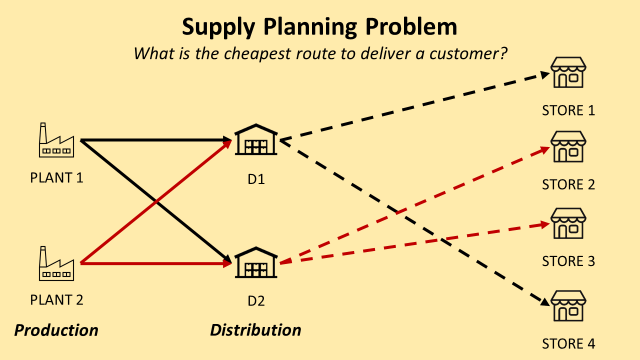
I propose a similar problem to find the right approach.
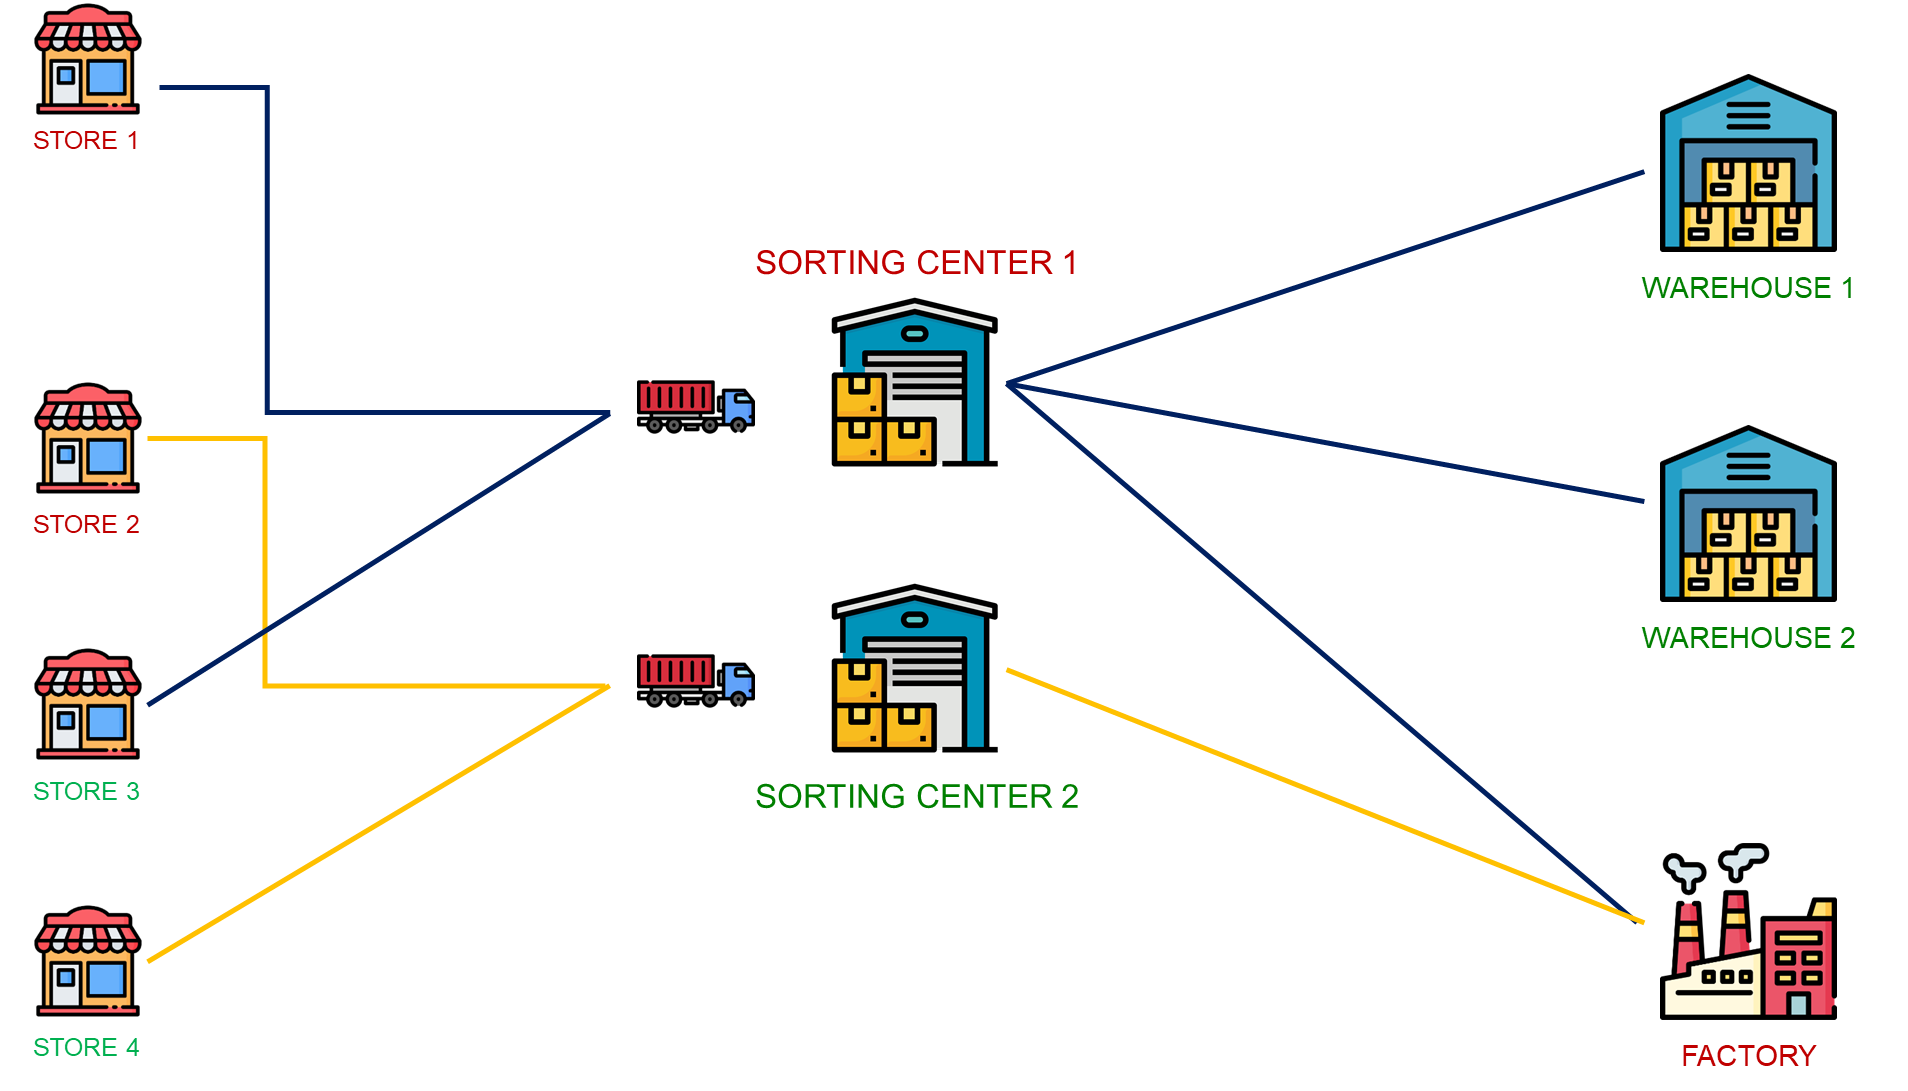
Supply Planning Problem: Several factories replenish distribution centres that store goods and deliver stores. We can use linear programming to
- Manage the upstream flow from the plants to the warehouses
- Deliver each store from the right distribution centre
How can the solution to the sorting centre allocation problem be adapted?
This solution can be used after slight adaptations
- Forecast the volumes from the sorting centres to the warehouse
- Define the capacity of each sorting centre
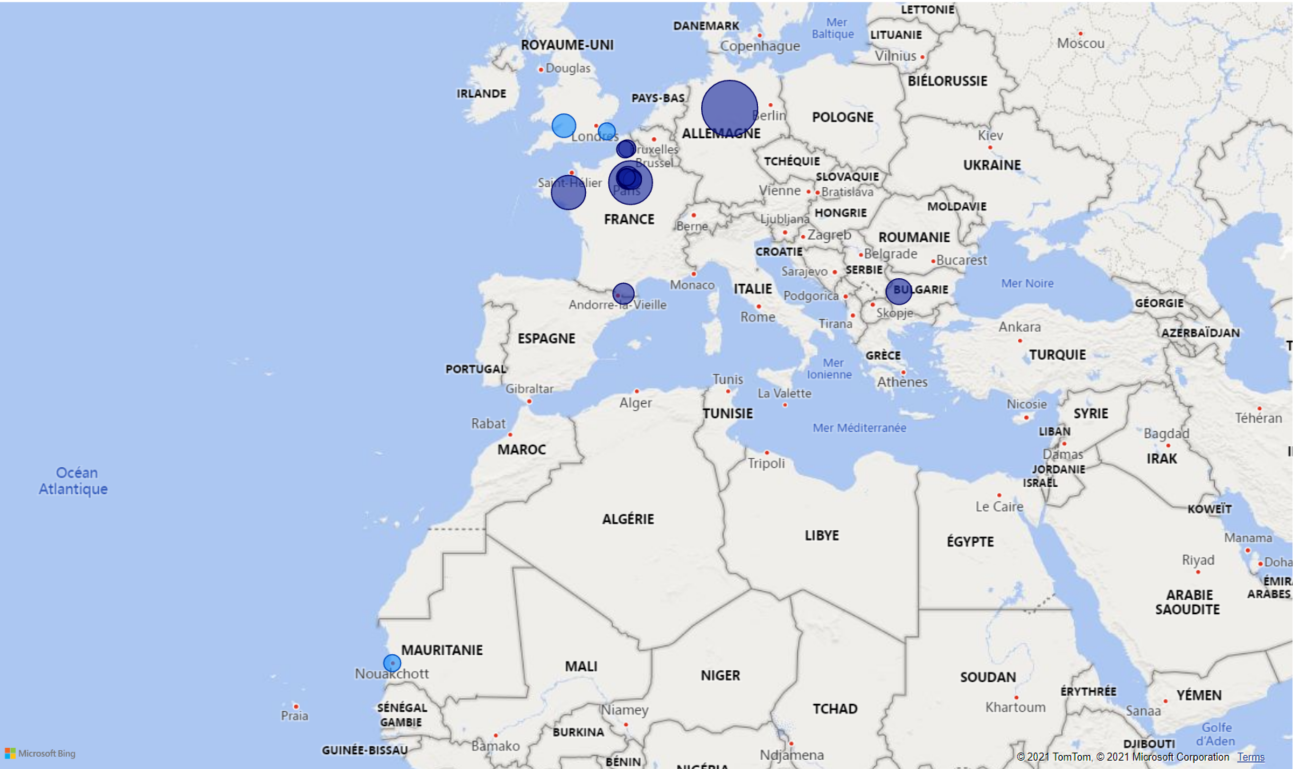
- Calculate the distances from each store to all distribution centres
If you need an example, feel free to have a look at this article
Supply Planning using Linear Programming with Python
This can significantly reduce your costs but may induce additional CO2 emissions.
Can we measure the additional CO2 emissions due to the collection from stores?
Measure Scope 3 Emissions of your Distribution Network
The original aim is to reduce your company's environmental footprint.
Therefore, the worst-case scenario would be to see CO2 emissions exploding due to poor management of the reverse flow.
My first sustainability project was to measure the scope 3 emissions of the distribution network in a FMCG company.
How to measure Scope 3 CO2 emissions with Python?
We could follow the protocol of the French Environmental Agency Ademe.
The formula to estimate the CO2 emissions of transportation using emissions factors is:

- E_CO2: emissions in kilograms of CO2 equivalent (kgCO2eq)
- W_goods: weight of the goods (Ton)
- D: distance from your warehouse to the final destination(km)
- F_mode: emissions factor for each transportation mode (kgCO2eq/t.km)
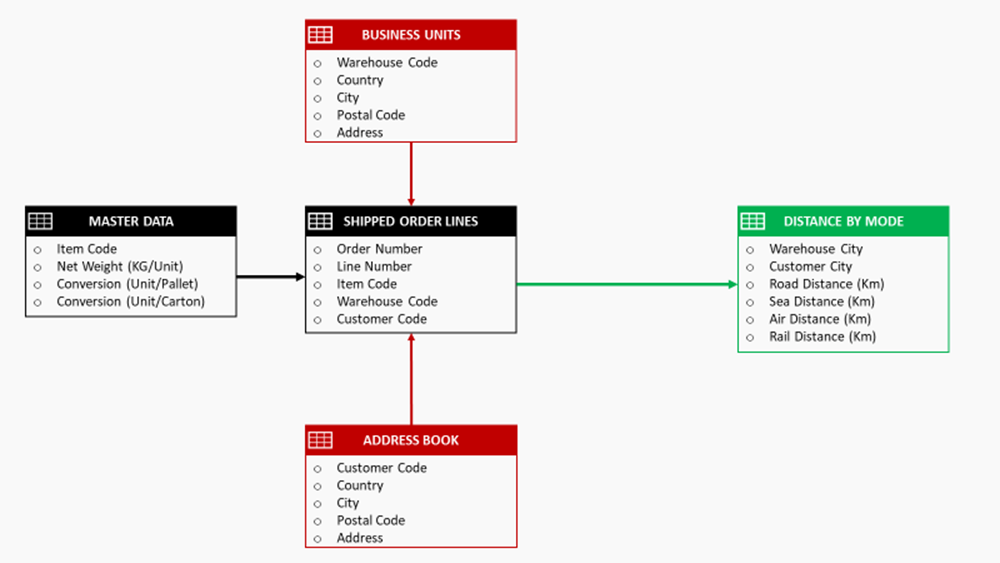
Hopefully, these parameters can be collected using business intelligence solutions from systems’ master data and transactional data.
The objective is to monitor the emissions of your reverse logistics operations with advanced visualizations.
For more information, have a look at this article.
Supply Chain Sustainability Reporting with Python
Now, you have a set of solutions to start supporting logistics operations and the sustainability department in implementing this rental model.
Conclusion
This simple methodology can be applied to any retailer's business case for transitioning to a circular economy.
This starts with simulating circular transactions,
- Use actual sales transactions for a specific period;
- Implement inventory management rules considering the rental periods and the reverse flow processes ;
- Estimate the impact on footprint reduction and the percentage of items reused ;
Then, improve the model by adding specific metrics to estimate the additional workloads for store operations and transportation
- Take the angle of a Supply Chain Solution Designer that uses volumes and logistic ratios to design processes ;
- Use the insights to make decisions that will ensure smooth operations with high efficiency
The approach presented in this article provides the data I would (as a supply chain solution designer in a Logistics company) ask a retailer requesting my support in designing this kind of solution.
What’s next?
Implementing a circular model is not the only initiative to reduce the footprint of a supply chain.
You can improve a linear model by producing and delivering products more efficiently.
If you need more inspiration with actual operational cases, have a look at this article.
Data Analytics for Supply Chain Sustainability
About Me
Let’s connect on LinkedIn and Twitter. I am a Supply Chain Engineer who uses data analytics to improve logistics operations and reduce costs.
If you are interested in data analytics and supply chain, please visit my website.
Samir Saci | Data Science & Productivity
Simulate the Challenges of a Circular Economy for Fashion Retail was originally published in Towards Data Science on Medium, where people are continuing the conversation by highlighting and responding to this story.
from Datascience in Towards Data Science on Medium https://ift.tt/DdeZbjP
via IFTTT


