Water Cooler Small Talk: The Birthday Paradox
Data Science | Statistics
A look at the counterintuitive mathematics of shared birthdays
Water cooler small talk is a special kind of small talk, typically observed in office spaces around a water cooler. There, employees frequently share all kinds of corporate gossip, myths, and legends, inaccurate scientific opinions, indiscreet personal anecdotes, or outright lies. Anything goes. So, in my Water Cooler Small Talk posts, I discuss strange and usually scientifically invalid opinions I have overheard in the office that have literally left me speechless.
Here’s the water cooler opinion of today’s post:
I work in an office floor with 60+ people, and last week two of them had their birthdays on the same day. Realizing they shared their birthday, they had a conversation somewhere along the following lines:
- I cannot believe we have our birthdays on the same day!
- Yes, what are the chances?
..and everyone commented on how strange it was. A crazy, karmic coincidence…
🌌🥳
But for real, what are the chances? With a quick estimation, one may think that the chances of such an event should be very low. Nonetheless, in fact there is a fairly high chance for any two people in a fairly large group to have the same birthday.
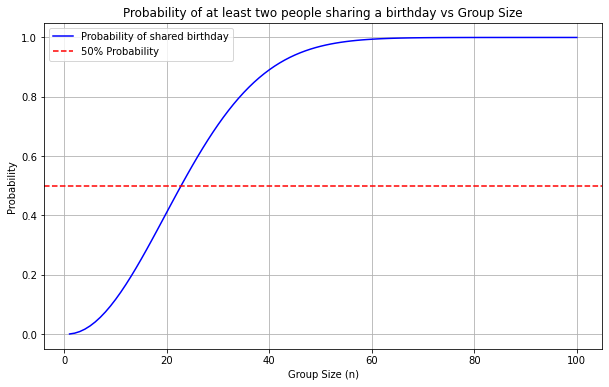
Actually, it only takes 23 people so there is a 50% chance any two of them share their birthday. On the flip side, for 366 people, it is mathematically guaranteed that at least two of them will have the same birthday, given that we ignore leap years. But even for the 60-something people on my office floor, the probability is 0.9941 — extremely high. Yet, we all seem very surprised to realize our birthday coincides with Sara’s from Accounting because it seems like such an improbable event.
🍨DataCream is a newsletter offering data-driven articles and perspectives on data, tech, AI, and ML. If you are interested in these topics subscribe here.
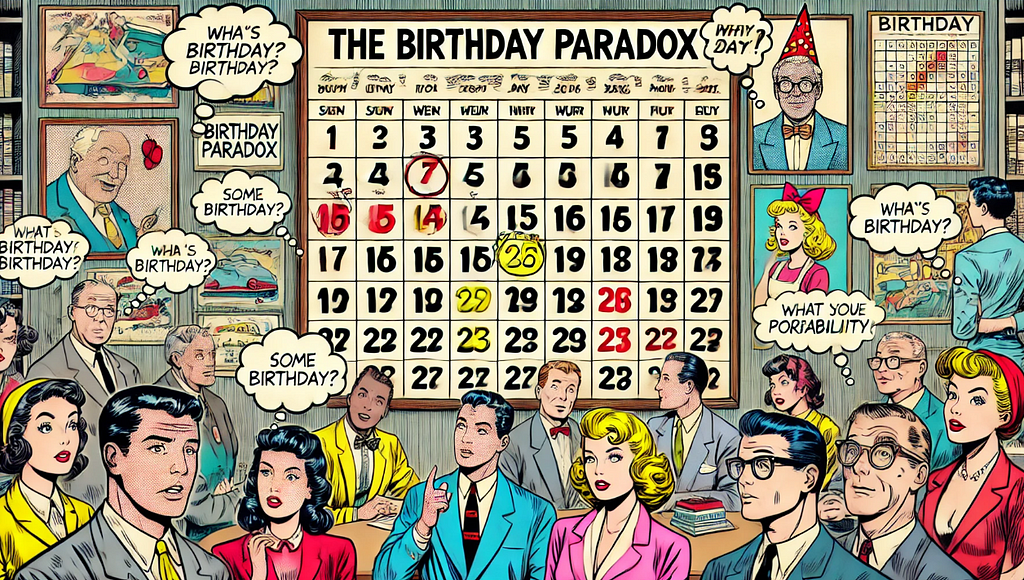
The Birthday Paradox
So, the Birthday Paradox refers to the fact that the following statement, even if mathematically proven and correct, is highly counterintuitive and appears to be false at first glance.
For a set of n = 23 randomly chosen people, there is more than a 50% chance that at least two of them are going to have the same birthday.
🎂🙄
But why is that? Let’s take a little look at the math of it:
We want to calculate the probability that at least two people in a group of n=23 have the same birthday. But this seems like a difficult thing to get our heads around. Maybe it’s easier to calculate the opposite event first — that is, the probability that no two people share a birthday. Then, we subtract this from 1 to get the probability of at least one shared birthday.
We also make the following assumptions:
- There are 365 days in a year — leap years are not taken into account.
- Each person is equally likely to be born on any of those 365 days.
So, for the first two people of the group, the possibility to have their birthdays on different days should be 364/365 ~= 0.9972. That is, there are 364 different days available out of the 365, that the second person can have their birthday on, in order for it to be different from the only day the first person has their birthday on.
Now, considering a third person in this group, the possibility for them to have a different birthday from both the first and the second person should be 363/365 ~= 0.9945. In other words, given that the first and the second person have their birthdays on separate days, only 363 days remain out of the 365 for the third person to have their birthday on, in order for it to not coincide with any of the previous birthdays.
Similarly, we can extend this calculation for the rest of the n people of the group. It is clear that for each subsequent person, there are fewer and fewer days available, and ultimately the probability that the n-th person has a unique birthday is:

We can then calculate the total probability of ‘no two people out of n sharing a birthday’ as a dependent probability — the product of all the individual probabilities, each of which depends on the previous outcomes.

So, now that we have defined the inverse probability, we can easily also calculate the probability that we are interested in:

We can then quickly plot how this probability changes over the size n of the group in Python using the matplotlib library:
import matplotlib.pyplot as plt

# probability of at least two people sharing a birthday
def birthday_problem(num_people):
    days_in_year = 365
    prob_no_shared_birthday = 1.0

    for i in range(num_people):
        prob_no_shared_birthday *= (days_in_year - i) / days_in_year

    return 1 - prob_no_shared_birthday

# check for group sizes from 1 to 100
group_sizes = range(1, 101)
probabilities = [birthday_problem(n) for n in group_sizes]

# plot
plt.figure(figsize=(10, 6))
plt.plot(group_sizes, probabilities, label="Probability of shared birthday", color="blue")
plt.axhline(y=0.5, color='red', linestyle='--', label="50% Probability")
plt.title("Probability of at least two people sharing a birthday vs Group Size")
plt.xlabel("Group Size (n)")
plt.ylabel("Probability")
plt.grid(True)
plt.legend()
plt.show()
Is it just that we are selfish?
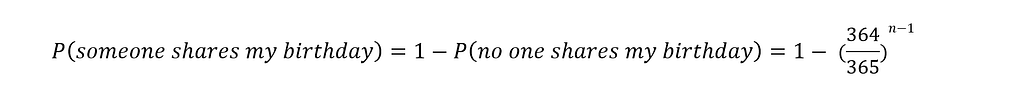
The real question is why this is so counterintuitive — why our intuitive estimations and predictions about the problem fall so short. One logical explanation is that people mainly care for themselves. That is, when we say ‘What is the probability of any two people in a group sized n having the same birthday’, what most of us really hear is ‘What is the probability of someone in a group sized n having the same birthday WITH ME’. Apparently, this is a different problem resulting in a much smaller probability. Let’s try to calculate how small it is, again by calculating the inverse probability. That new probability would be ‘no one shares my birthday’.
For me and another person, the probability of not having the same birthday would be 364/365, same as before. Nonetheless, this time for any new person added to the group the probability of them not sharing my birthday is again 364/365. Thus, for a group of n people, the probability that any of them does not have the same birthday with me would be:

…and then we can calculate the probability we are interested in as before:
Finally, we can check how this probability changes with the size of the group n:
# probability of at least one person sharing your birthday in a group
def birthday_match_for_me(group_size):
    days_in_year = 365
    prob_no_match_for_all = ((days_in_year - 1) / days_in_year) ** (group_size - 1)
    return 1 - prob_no_match_for_all

# check for group sizes from 2 to 100
group_sizes = range(2, 500)
probabilities = [birthday_match_for_me(n) for n in group_sizes]

# plot
plt.figure(figsize=(10, 6))
plt.plot(group_sizes, probabilities, label="Probability of sharing your birthday", color="green")
plt.axhline(y=0.5, color='red', linestyle='--', label="50% Probability")
plt.title("Probability of at least one person sharing your birthday vs Group Size")
plt.xlabel("Group Size (n)")
plt.ylabel("Probability")
plt.grid(True)
plt.legend()
plt.show()
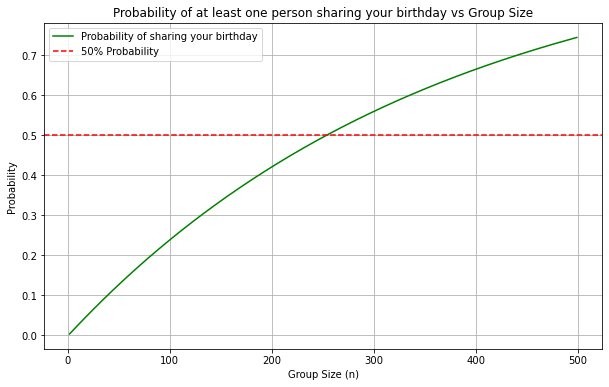
Indeed, with this reformation of the problem, the calculated probability is very small for the 23-person group of the initial problem — just 5.86%, which intuitively may seem like a logical, correct solution to the initial problem. This time the probability grows very slowly with the group size n and it would take a group of 254 people to reach a 50% chance of ourselves having the same birthday with somebody.
Is it just that we are bad at math?
Apart from the fact that we are focused on ourselves and often struggle to see beyond our noses, another logical explanation of the Birthday Paradox is that people generally struggle with statistics. Once again, our silly little human brains fail to effectively interpret concepts like probability, combinations, or interactions among many elements.
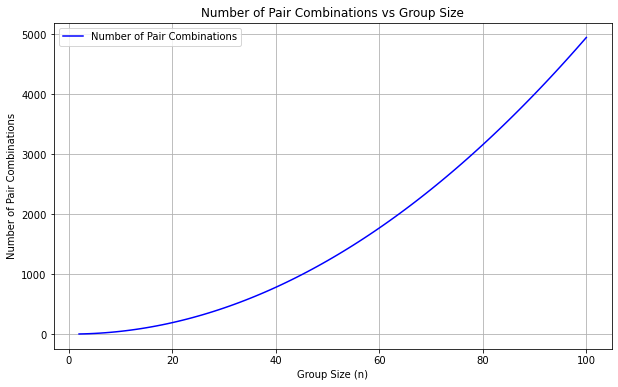
For instance, we might struggle to get a grip on the concept of quadratic growth of the possible pairs of people in the group, as the group size grows. In particular, for a group of n people, the possible pair combinations among them is:

This formula shows that the number of pairs increases rapidly with group size n. This explains why the probability of a shared birthday rises quickly even in relatively small groups like n = 23. Nonetheless, 23*(23–1)/2 isn’t exactly what naturally comes to our minds when we first hear about two of our colleagues having the same birthday.
Again, we can quickly check how this plots in Python:
# number of pair combinations in a group of size n
def number_of_pairs(n):
    return n * (n - 1) // 2  #integer division

# check for group sizes from 2 to 100
group_sizes = range(2, 101)
pair_combinations = [number_of_pairs(n) for n in group_sizes]

# plot
plt.figure(figsize=(10, 6))
plt.plot(group_sizes, pair_combinations, label="Number of Pair Combinations", color="blue")
plt.title("Number of Pair Combinations vs Group Size")
plt.xlabel("Group Size (n)")
plt.ylabel("Number of Pair Combinations")
plt.grid(True)
plt.legend()
plt.show()
An additional math pitfall of the problem is our inability to understand if an event is independent or not. That is, many people might assume that each new person added to the group is an independent event in terms of probability, meaning that each new person has a small, fixed chance — namely (1/365) — of having the same birthday as someone else.
Nevertheless, this is not the case. In reality, for each new person joining the group, the probability is calculated anew, since the probability of a match depends on all previous people that already are in the group. To put it differently, adding more people affects the overall probability because the set of possible pairs grows — the probabilities are interdependent, not fixed for each person. In this way, each new addition makes it increasingly probable that a match will occur.
On my mind
Let’s admit it — our brains were just not made for statistics! Most of the time, we tend to overestimate the improbability of coincidental events, mainly because we are unable to come up with a good estimation, either intuitively, or even algorithmically by following the correct calculation steps. It seems that we just can’t figure it out. 🤷♀️ Often, in our day-to-day lives, we are surprised by coincidences — what are the chances, we wonder? Randomly meeting our boss on our trip to Italy, repeatedly noticing ‘11:11’ on our phone, thinking of our mom right before she texts us, or even meeting somebody who shares our birthday — our jaws drop every time. Yet, as the Birthday Paradox shows, these impossible coincidences are often mathematically much more likely than we think.
Loved this post?
💌 Join me on Substack or LinkedIn ☕, or Buy me a coffee!
or, take a look at my other water cooler small talks:
Water Cooler Small Talk: Gambler’s Fallacy and Ruin
Water Cooler Small Talk: The Birthday Paradox 🎂🎉 was originally published in Towards Data Science on Medium, where people are continuing the conversation by highlighting and responding to this story.
from Datascience in Towards Data Science on Medium https://ift.tt/FoSxNrl
via IFTTT