Are you Aware of the Potential of Your Data Expertise in Driving Business Profitability?
A reflection of a supply chain data scientist who randomly discovered the power of data analytics to help small and large businesses

The biggest challenge I faced in analytics projects was estimating the return on investment (ROI) of a solution.
What is the ROI of a forecasting engine for sales prediction?
This is often the first question a decision-maker asks when you propose designing a tool to solve their operational or business problem.
As a solution design manager in logistics, my job was to price warehousing and transportation operations for retail and fashion companies.
Because of this, estimating the ROI of my solutions was slightly more manageable, but it was still difficult to convince decision-makers.
For example, I would explain, “This algorithm will improve picking productivity by 25%, which will result in a 12% reduction in variable costs.”
These successes inspired me to share the solutions covering 60+ operational case studies published on this Medium blog.
While my focus was on improving logistics operations, something unexpected happened along the way:
What if I shifted my focus to business profitability?
In one project, I applied these tools to a business case study: maximizing the profitability of a bakery.
The feedback I received helped me realize that both small and large businesses need to optimize their margins and automate data-driven decisions.
By speaking the language of business, I could sell my analytics solutions more effectively.
In this article, I want to share the insights I’ve gained from discovering the power of data to help businesses — and why I believe you should consider this path, too.
Summary

I. Introduction
Exploring the challenge of proving ROI in analytics projects
II. How Did I Develop My Business Acumen?
Sharing my early career experience as a Solution Design Manager
III. My journey discovering data analytics for business optimization
Optimization methods to help a bakery business improve profitability.
VI. Use your Analytics Skills to Solve Business Problems
How data analytics can answer the needs of decision makers.
V. How to Adapt your Analytics Approach to Business Problems?
The importance of translating business problems into simple analytics solutions
VI. Conclusion
Understanding processes is an important skill to answer business problems
How did I develop my business acumen?
For the first four years of my career, I designed warehousing and transportation solutions for major international companies across Asia.
What does a Supply Chain Solution Design Manager do?
For example, imagine a retailer like Costco wants to set up a distribution centre in Shanghai.
- They provide data on volumes and process requirements in an RFP.
- My job is to design the solution (layout, staffing, equipment) and develop the pricing based on a cost model with over 100 parameters.
- We present the solution to the customer with a detailed pricing grid.
Our main concern? Gross margin!
To win the project, I had to ensure competitive pricing while maintaining a minimum margin without pricing below our costs.
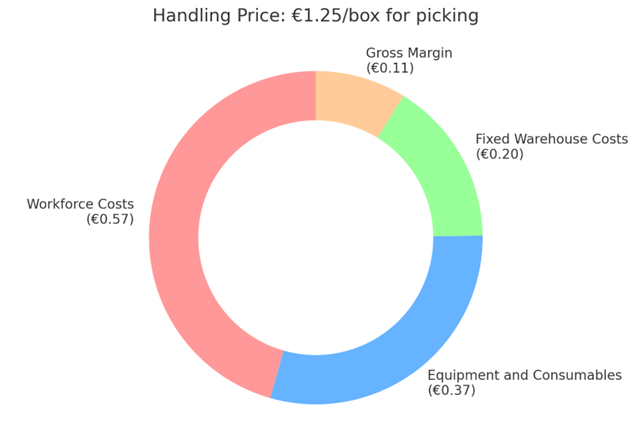
For example, if I quoted €1.25 per box for picking, I knew exactly how the costs and margin were broken down
- €0.57 for workforce costs
- €0.37 for equipment and consumables
- €0.20 for fixed warehouse costs
- €0.11 for our gross margin (an 8.8% margin on sales)
What’s next? You win the business and sign a three-year contract for a 5M€ budget.
But what happens if the customer wants to lower the price to €1.10 per box?
This often happens in low-margin companies like traditional retailers, automotive after-sales distributors or consumer goods.
You must find ways to reduce costs while keeping your 8.8% margin intact.
Therefore, I have been using data analytics to
- Reduce Warehouse Space with the Pareto Principle using Python
- Improve Warehouse Picking Productivity with Pathfinding Algorithms
- Optimize Transportation Routing with Graph Theory using Python
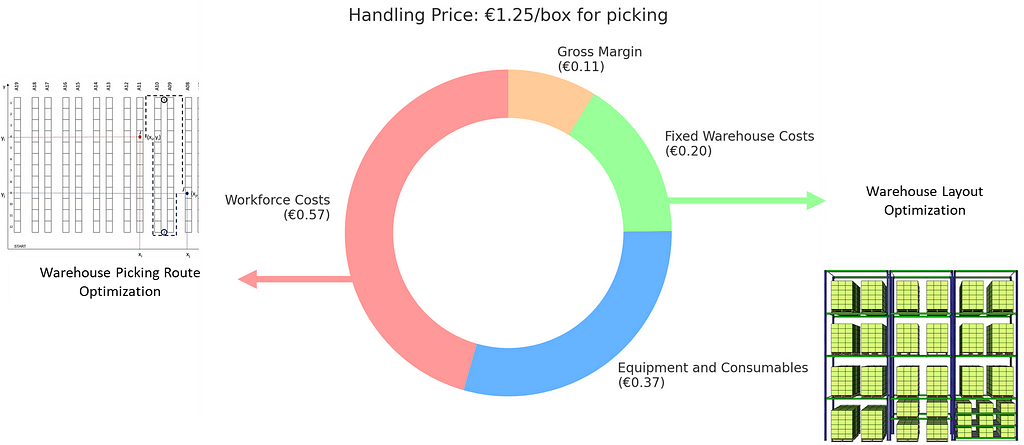
Along with many other operational improvements supported by data analytics, which are shared in this Medium blog.
Can I apply similar methodologies outside of logistics?
My journey discovering data analytics for business optimization
It began while consulting for a small logistics company that delivered products to bakeries in Paris.
With my naive perspective as a solution designer, I spoke with a bakery chain owner to understand their business model:
- What is the profit margin (%) on a baguette sold for €1.50?
- How much does the workforce cost (€) per croissant sold?
- What percentage (%) of your costs are fixed?
- What is the most profitable item in your shop?
To my surprise, they couldn’t answer any of these questions.
I realized there was another approach to doing business, where prices were set without explicit knowledge of the underlying costs, and operational visibility was almost zero.
This was a huge opportunity — what if we provided these business owners with the visibility and insights they desperately needed?
So, I took on the challenge of modelling a bakery.
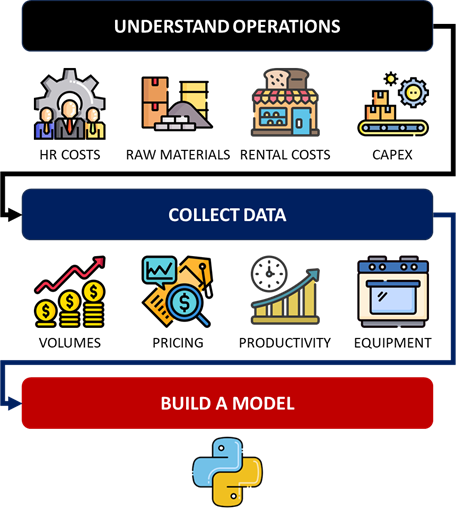
I applied the same methodology I used for continuous improvement projects in logistics:
- Understand their current operations: fixed and variable costs, bottlenecks and revenue sources.
- Collect and process data, making necessary assumptions (e.g., production costs and sale prices for each item).
- Build a Python model to replicate their current setup and simulate different scenarios.
The result is the solution presented in the article: Maximize Business Profitability with Python.
What is the most profitable mix of products to sell?
Considering the limited resources to produce and store products, this model can provide the exact mix of products to sell.
The impact on the client exceeded my expectations.
“This is the first time I can estimate the impact of my business strategies on overall profitability,” the owner said.
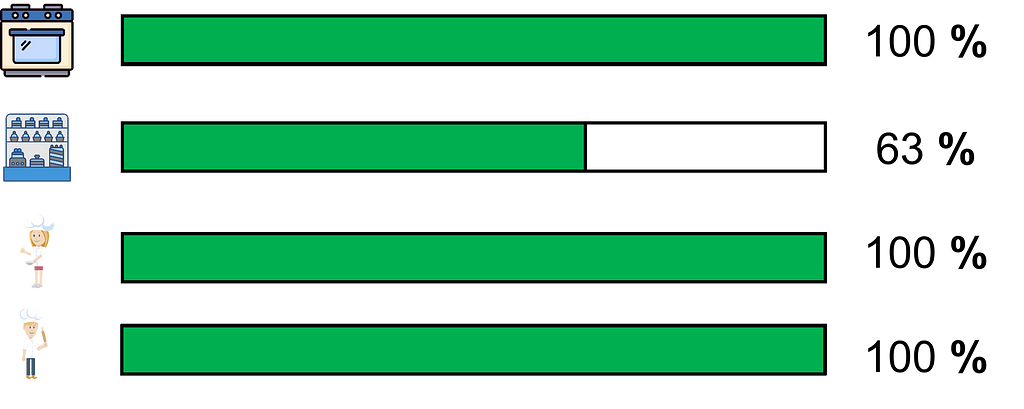
After several iterations, we improved the algorithm to provide interesting insights.
Samir: “The bottlenecks of your production are the human resources and your oven capacity.”
For such a simple algorithm, coded in less than an hour, the perceived business value was far greater than what I experimented with in the past.
This marked a turning point in my approach to using data analytics for business impact.
How can you support businesses with your analytics skills?
Use your Analytics Skills to Solve Business Problems
Since starting my consultancy and developing my sustainable supply chain SaaS, I exchanged with dozens of entrepreneurs across multiple industries.
This is an opportunity to assess my capabilities of solving their problems with data and business acumen.
What do they need? Let’s explore an example!
A friend of mine, who runs a small business in the F&B industry, used my model to support decision-making and maximize revenue.

They source renewable cups from China and ship them via air or sea freight to a local warehouse.
From the warehouse, the cups are delivered to coffee shops and distributors.
What problems can data analytics solve in this case?
Among his biggest challenges were inventory management and cash flow.
“We’ve had to turn down orders because we don’t have enough cash to pay suppliers for restocking,” he explained.
The core issue was clear: they needed visibility on their financial flows.
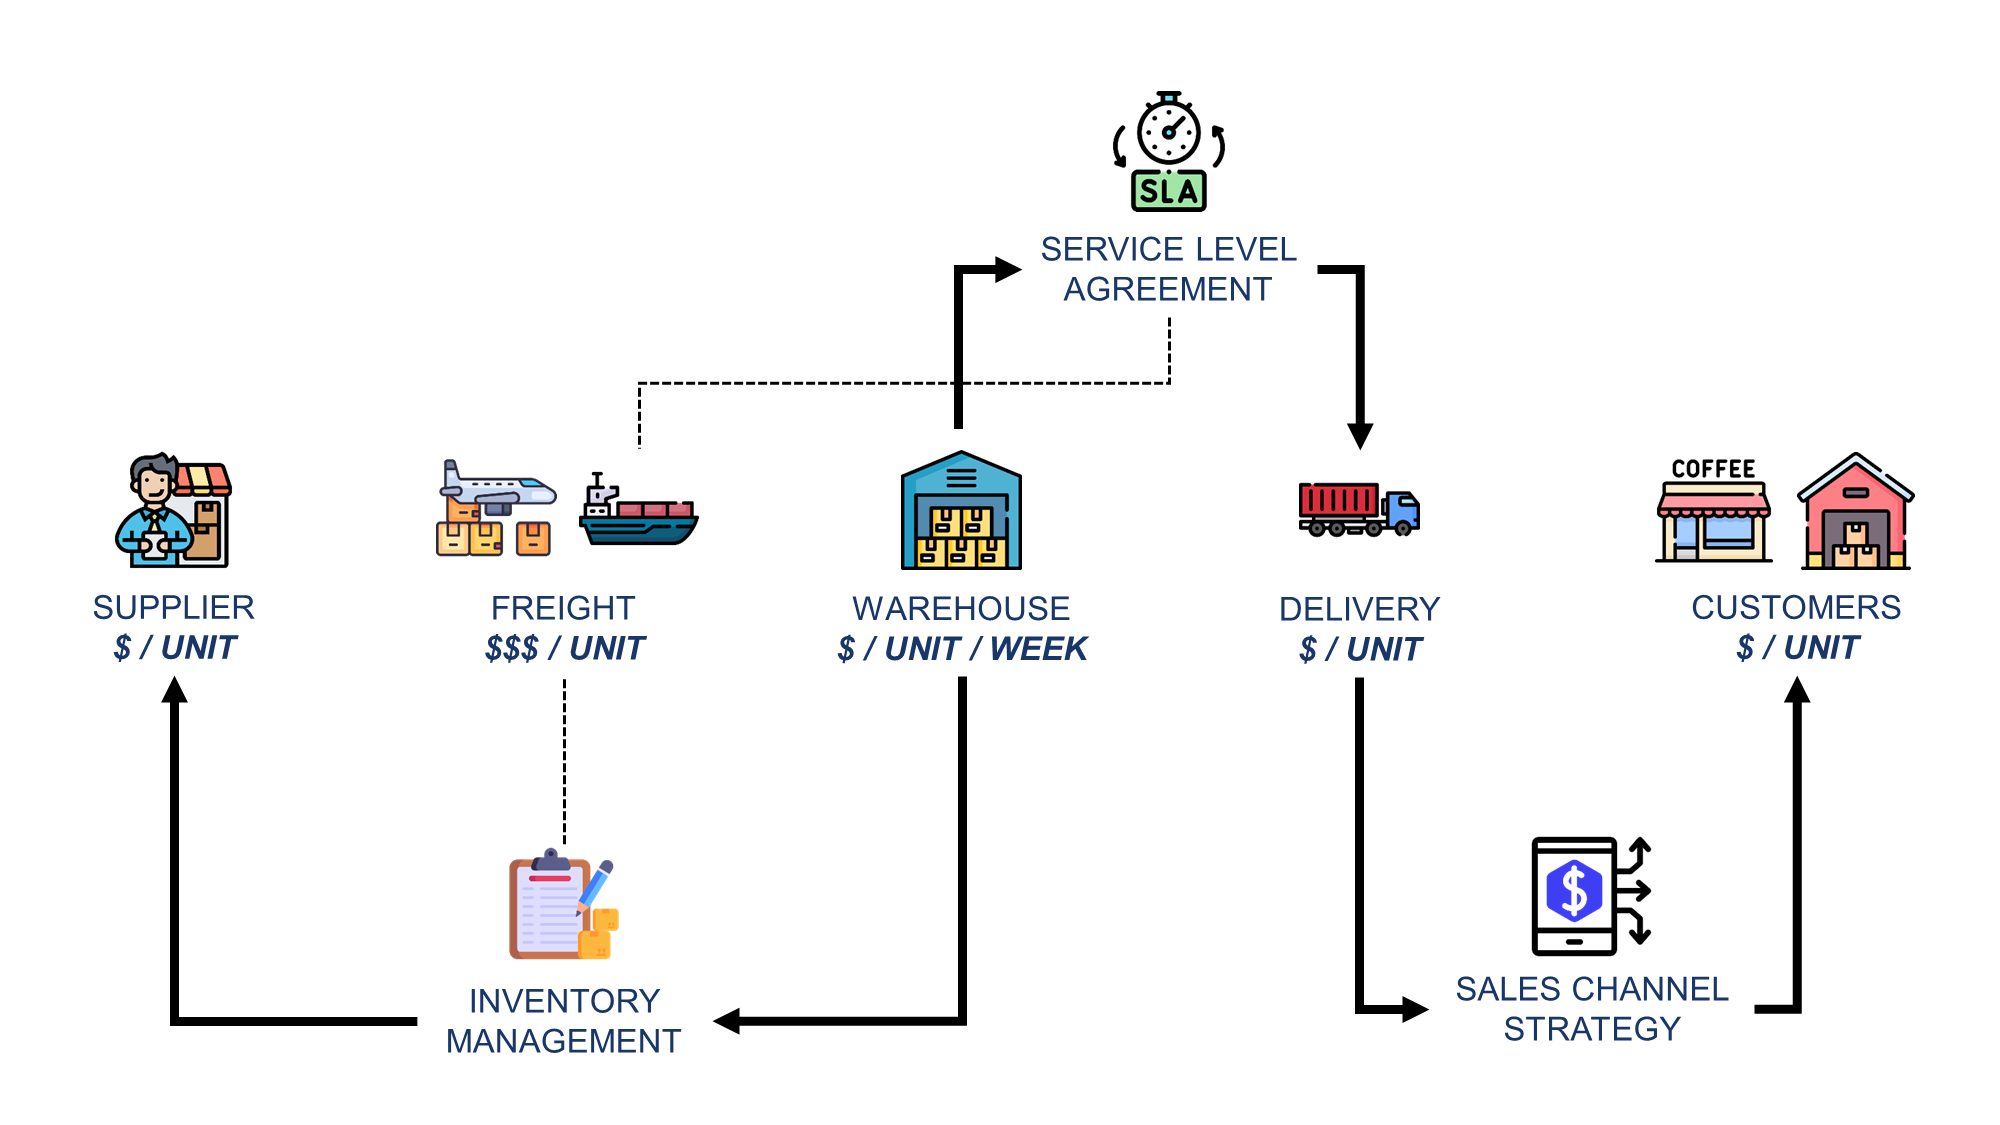
I needed to map out all the parameters involved to address this issue and model the value chain.
- Payment terms and lead times from suppliers.
- Service level agreements and payment terms with customers, segmented by sales channels (direct customers vs. distributors).
- Fixed operational costs and cash flow management.
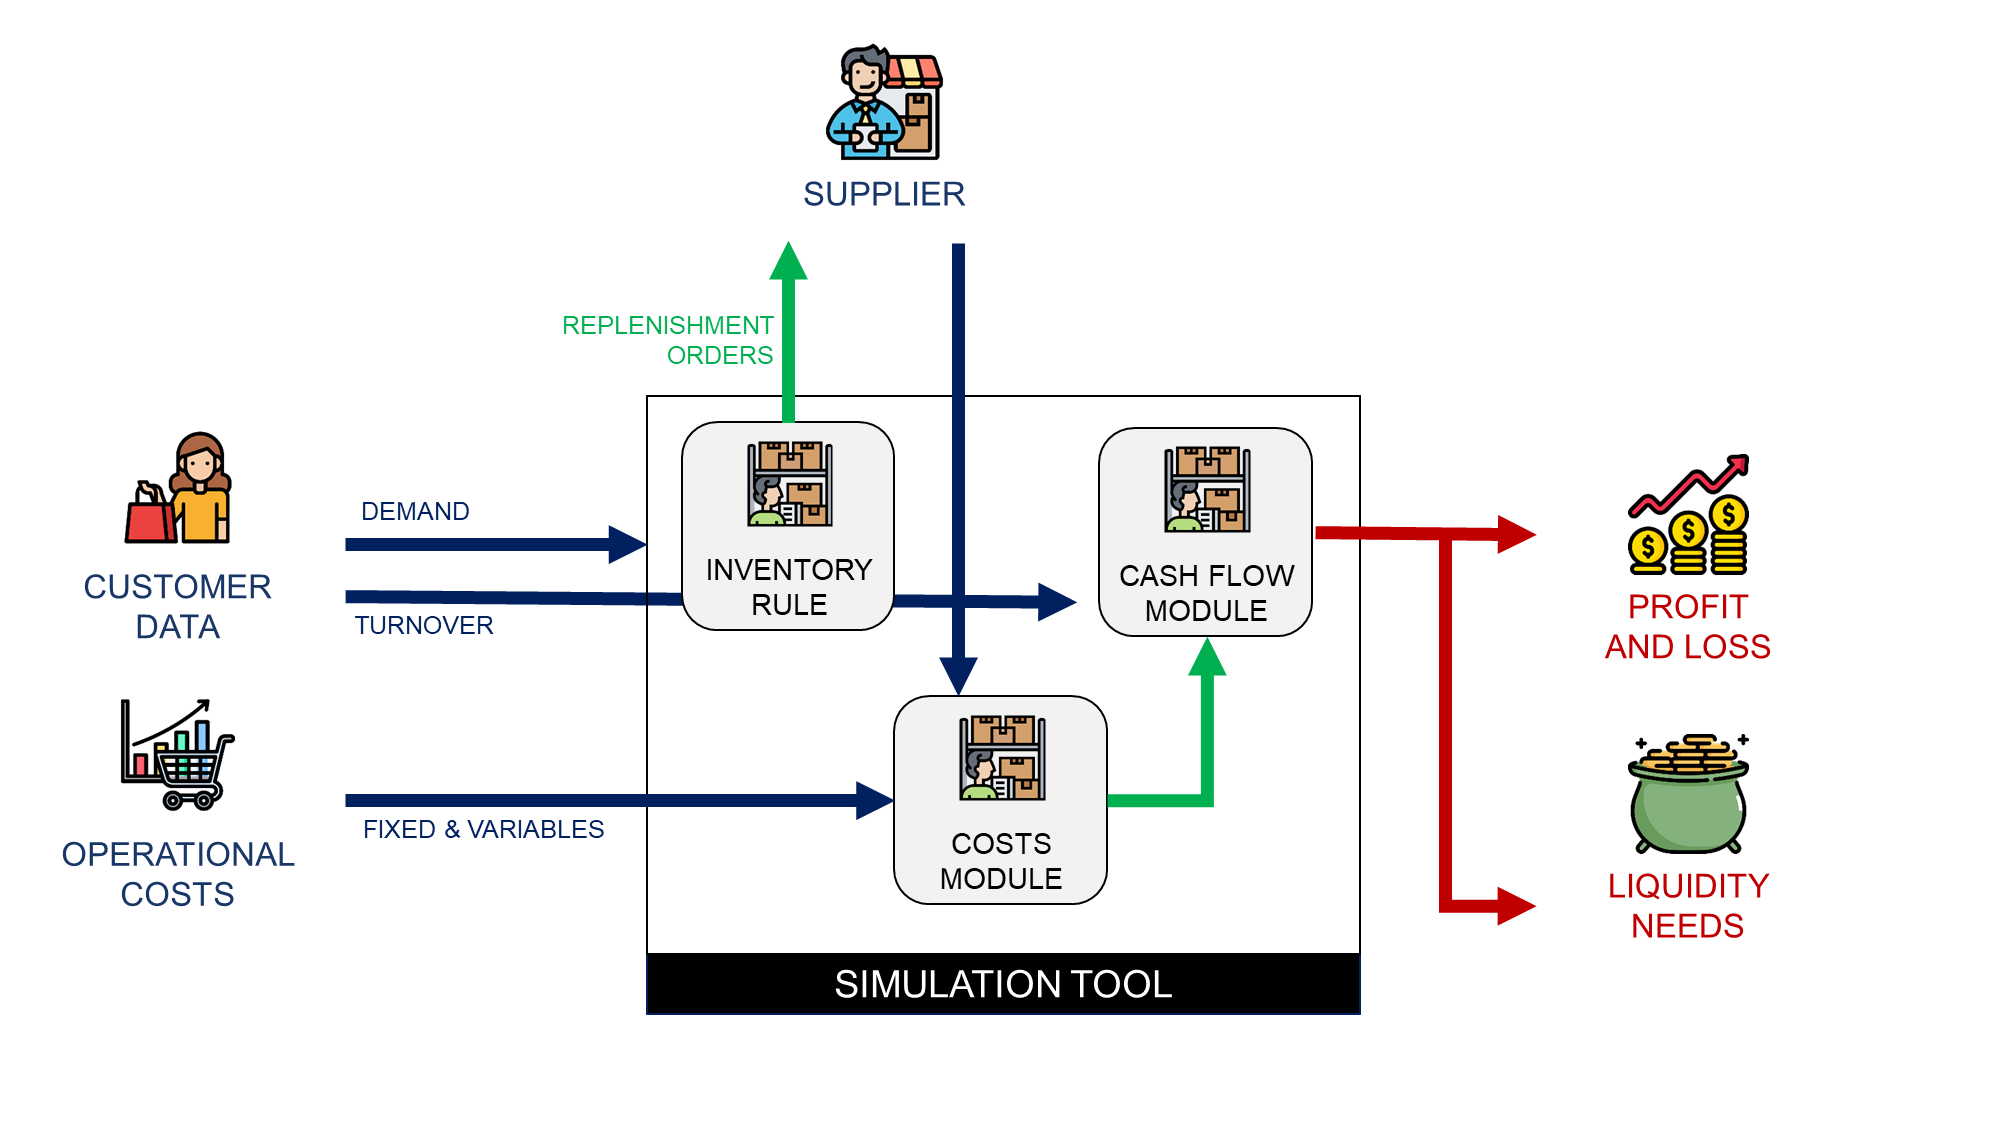
The result is a simulation engine written in Python (with a reasonable granularity) that replicates my friend's business.
What’s next? We can answer all my friend's questions!
My friend's biggest frustration was the lack of visibility and the inability to test hypotheses.
- What if we reduce stock coverage from 8 weeks to 6 weeks?
- Would it be more cost-effective to use air freight for deliveries?
- Should we shift our sales strategy to focus only on distributors?
Due to the complexity of the parameters involved, he could not get clear answers before.
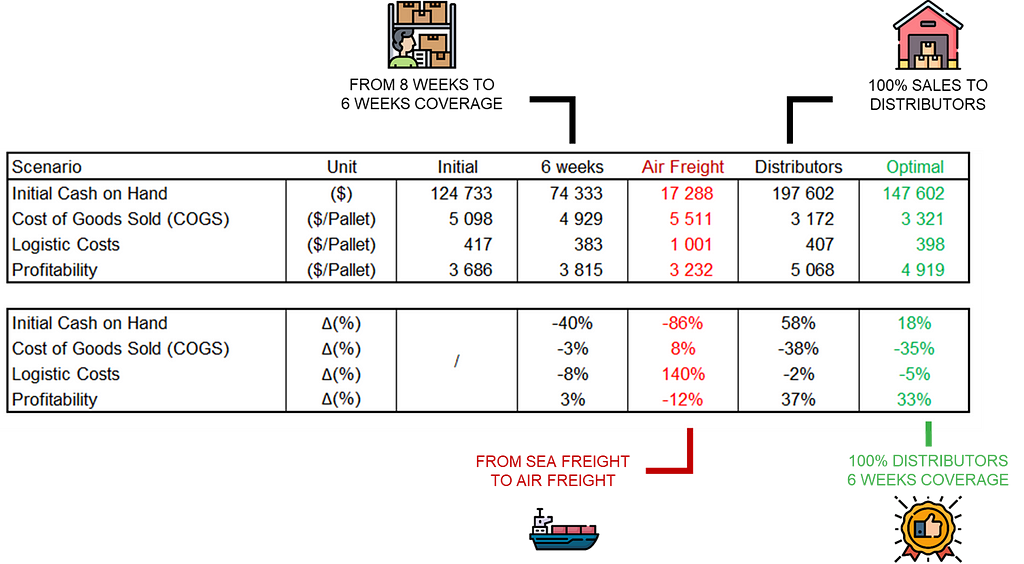
Simulating these hypotheses is a matter of seconds with the model.
This approach saved thousands of euros by confirming they could safely reduce stock coverage without risking disruptions to customer supply.
It turned out to be an incredibly powerful tool for managing his business, built with simple analytics by
- Understanding the parameters influencing the value chain
- Simulate “what if” scenarios to assess business strategies
- Find the optimal set-up to minimize costs and maximize profitability
Does this sound like an issue your business is facing? For more details, check out this article
Business Planning with Python — Inventory and Cash Flow Management
The insights from the model helped my friend reduce the cash needed to run the business and reduce the Cost of Goods Sold (COGS).
Later, we went beyond cost reductions by tackling revenue maximization.
He came back with another request related to pricing strategy.
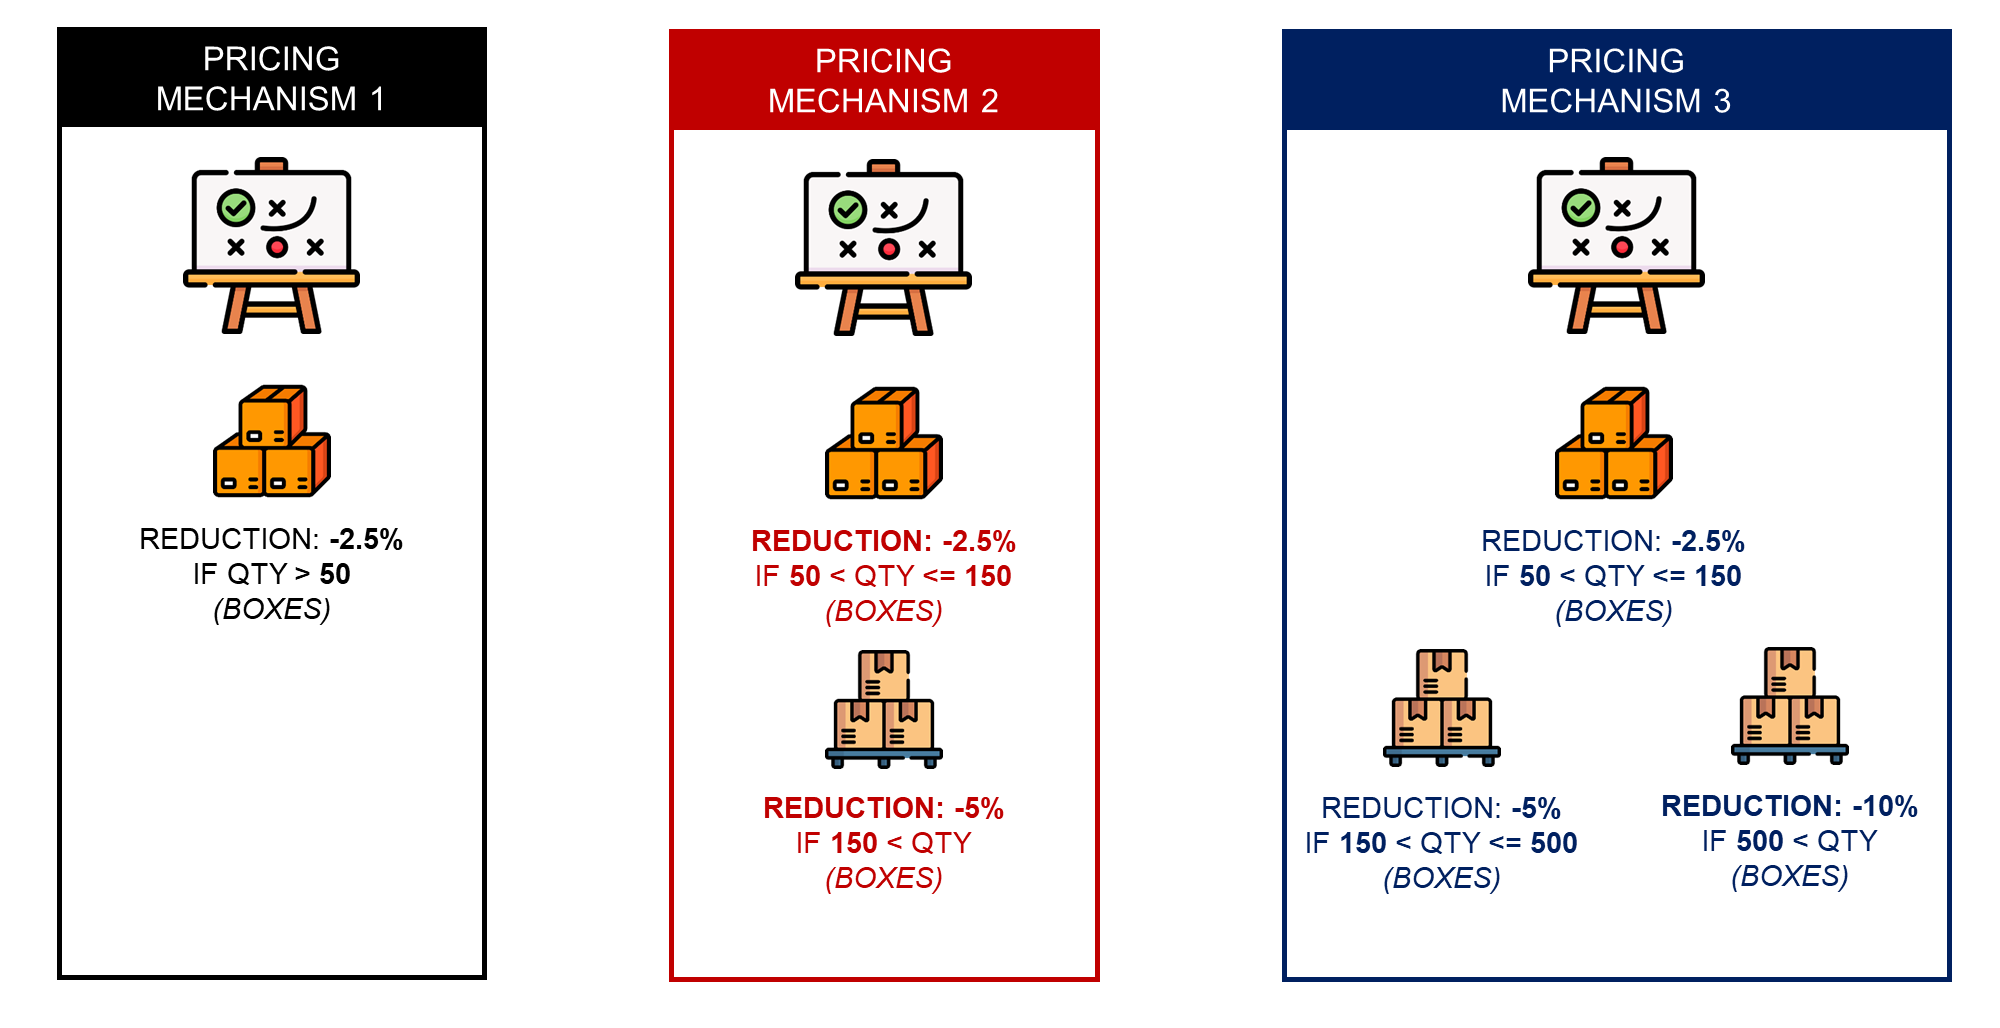
With their new business partner, an expert in F&B that brings capital and market expertise, they were drafting strategies to boost turnover.
She proposed multiple pricing strategies, presented above, to increase the quantity ordered by customers.
My friend: “How can I assess these strategies and their impact on profitability?”.
You just have to adapt the model by adding a pricing module and estimate the impact on profitability.
We can estimate the profitability and other business indicators for each pricing strategy with multiple volume scenarios.
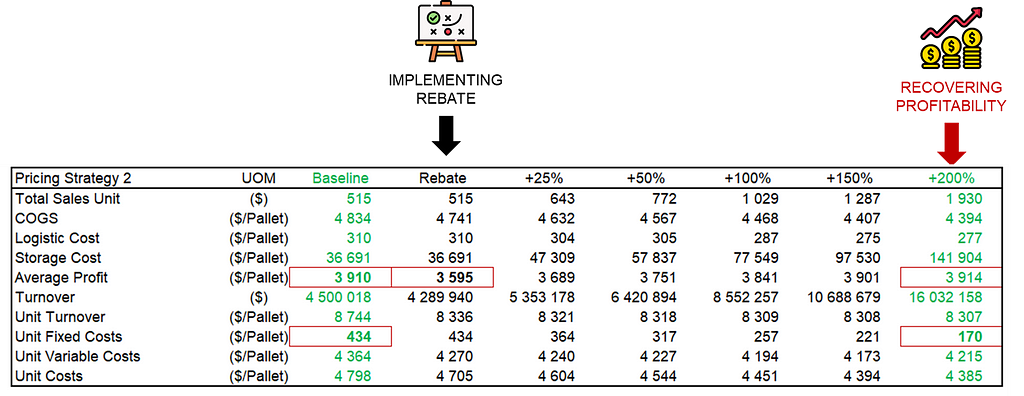
In the table above, we simulate the impact of pricing strategy two, assuming seven turnover scenarios.
Samir: “You need to get +200% growth to recover the profitability of your baseline scenario with this strategy.”
We can assess each strategy proposed with a few clicks.
Business Planning with Python — Revenue Optimization
The insights generated by the model helped resolve heated discussions between the co-founders.
The process allowed them to reach common ground on the pricing strategy backed by precise profitability projections.
It sounds great, right?
But what does it take to succeed in this kind of project?
How to Adapt Analytics Approach to Business Problems?
As I mentioned several times, the analytics solutions designed for these projects are usually “technically basic.”
I would say that 80% of the efforts are in translating the business problem into analytics solutions.
Be curious! Show interest in the business model.
It’s an active process of asking the right questions to understand which indicators are important for business owners and how to model processes.
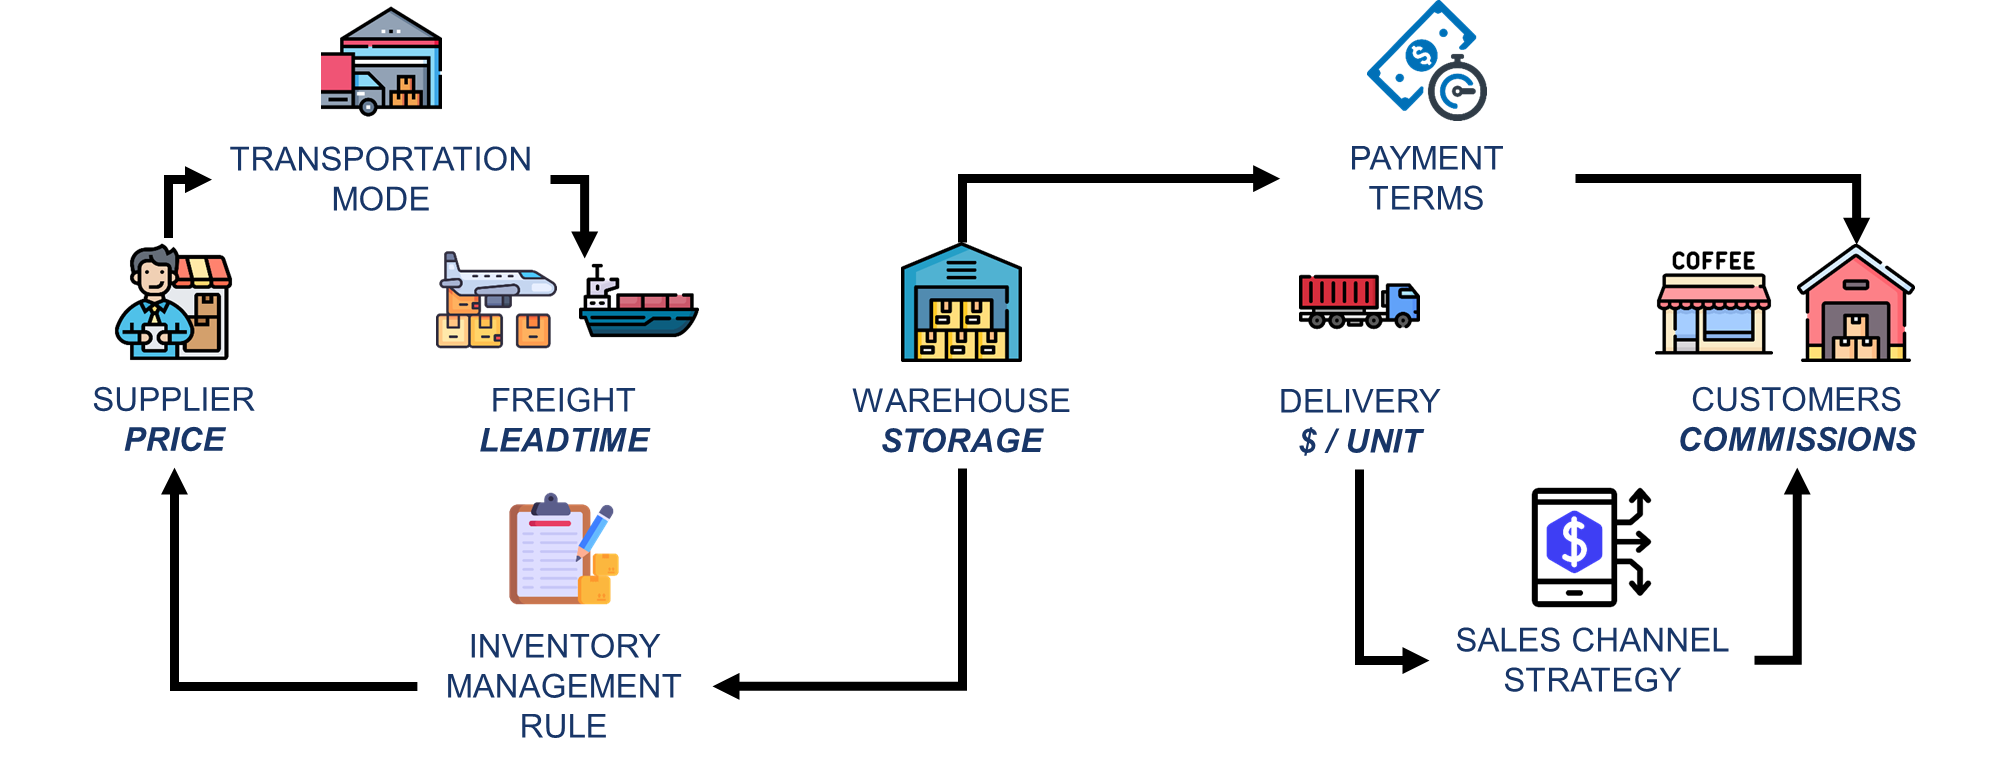
Before reaching this level of modelization, I needed multiple iterations with my friend to ensure that my model accurately reflected the reality of his business.
Therefore, you need to make your model’s insights accessible to a non-technical audience so they can help you assess the accuracy of the results.
Is there a demand for this kind of solution?
There is a market for that.
Since I started working full-time as a consultant, I have received more requests for this kind of project than for my core supply chain engineer skills.
As you directly impact profitability and provide visibility to business decision-makers, getting CAPEX and involvement for the project is easier.
What did we learn from these two examples?
- Business owners lack visibility on their processes and financial flows.
- Understanding business models and processes is essential to design the right simulation model.
- Decision makers value data-driven insights to support strategic projects.
This approach is adaptable to a wide range of business cases across different industries and company sizes.
Conclusion
I never expected to embark on a journey from a solution design manager optimizing logistics operations to a consultant helping businesses improve their profitability.
This is because I discovered that advanced analytics tools can be very effective in business optimization.
You don’t need to focus on the complexity of the analytics solutions (ML, optimization or GenAI) but on understanding the business.
Have you heard about sustainability?
I am currently learning about Europe's Corporate Sustainability Reporting Directive (CSRD).
This will shape how companies must report on their sustainability efforts
The idea is to introduce stricter requirements for transparency in environmental, social and governance (ESG) metrics.
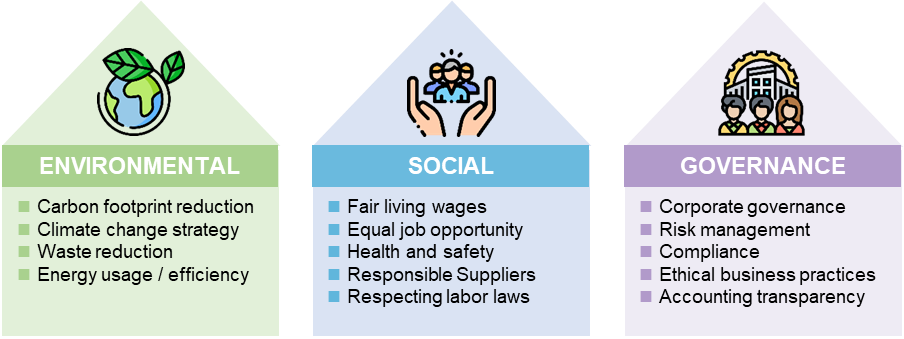
Our approach to business profitability presented in this article can also be applied to sustainability challenges.
Decision marker: “We need to reduce the scope 3 emissions of the distribution network by 30%.”
For example, in this article about Green Inventory Management, I shared a case study on reducing carbon emissions from store deliveries.
The idea is to find the optimal delivery frequency to minimize the CO2 emissions.

The approach to answering this operational problem presented in the article is similar.
- Understand the operations
Prepare and deliver orders for fashion retail stores - Build a simulation model with Python to estimate the emissions.
Inputs: Sales Data and Delivery Frequency / Outputs: CO2 emissions - Test several scenarios with multiple delivery frequencies and calculate the reduction of emissions.
If you are interested in finding solutions to reduce emissions,
Data Science for Sustainability- Green Inventory Management
A similar approach for different problems.
For any case study, it is crucial to be curious, ask the right questions and engage with decision-makers to truly understand their pain points.
By doing so, you can create models that provide actionable insights to technical and non-technical audiences.
In my experience, these insights can significantly improve profitability and support decision-making for operational transformations.
If you haven’t yet considered applying your expertise to business challenges, now is the time!
You might discover a new way to create impact — just as I did.
About Me
Let’s connect on Linkedin and Twitter. I am a Supply Chain Engineer using data analytics to improve logistics operations and reduce costs.
If you are interested in data analytics and supply chain, please visit my website.
Samir Saci | Data Science & Productivity
Are you Aware of the Potential of Your Data Expertise in Driving Business Profitability? was originally published in Towards Data Science on Medium, where people are continuing the conversation by highlighting and responding to this story.
from Datascience in Towards Data Science on Medium https://ift.tt/w35rAVP
via IFTTT


