
Eyal Kazin | Simpson’s Paradox | Causality
🪜 Mastering Simpson’s Paradox — My Gateway to Causality
Warning: You’ll never look at data in the same way

After appreciating that correlation does not imply causation, mastering Simpson’s Paradox is a crucial step in one’s journey to causal thinking 👣.
Most researchers and practitioners are likely to have come across this phenomenon at one stage or another. I can testify that in 2020, even after 15 years experience of analysing and interpreting data, I didn’t realise that this was a known issue that I should have been concerned about.
If you haven’t been exposed to Simpson’s paradox yet — prepare to have your mind blown 🤯. If you have, I aim to shine a light on aspects that you might not have considered 💡.
This is a beginner’s guide to identifying and resolving Simpson’s Paradox which will help you to avoid misinterpreting your data.
In order to understand this counterintuitive topic in this post you will:
- take a deep dive into a quantitative example
- examine a qualitative approach — learn how it appears in a graph model.
The importance of the quantitative walk through is that you’ll recognise the paradox when analysing your data and resolve for it. The value of the qualitative angle is to understand how to better design for analysis, experiment design and data collection.
Throughout I use intuitive visuals and keep the maths fairly light.
Ready to embark on something confusing but highly rewarding? 🧠
I promise that you will never look at data in the same way. 🔎
What Is Simpson’s Paradox?
In brief Simpson’s Paradox is a counter intuitive situation where the outcome of a population contrasts that of its sub populations.
In its most popular form it can be phrased as:
“Trends can exist in subgroups but reverse for the whole”
Let’s learn by example.
Note that in a previous article¹ I demonstrated the paradox using an intuitive visual. If you have read it, some aspects will be familiar, but we will dive deeper and use some equations (which we haven’t in the previous). In any case this post is self contained and does not require previous knowledge.
➡️ Start Asking Your Data “Why?” - A Gentle Intro To Causality
Visualising The Paradox
Imagine a clinical trial in which patients are given a treatment that results in a health outcome score. Our objective is to assess the average impact of an increased treatment to the health outcome.
For pedagogical purposes in all examples provided here we assume that samples are representative (i.e, the sample size is not an issue) and that variances in measurements are minimal.
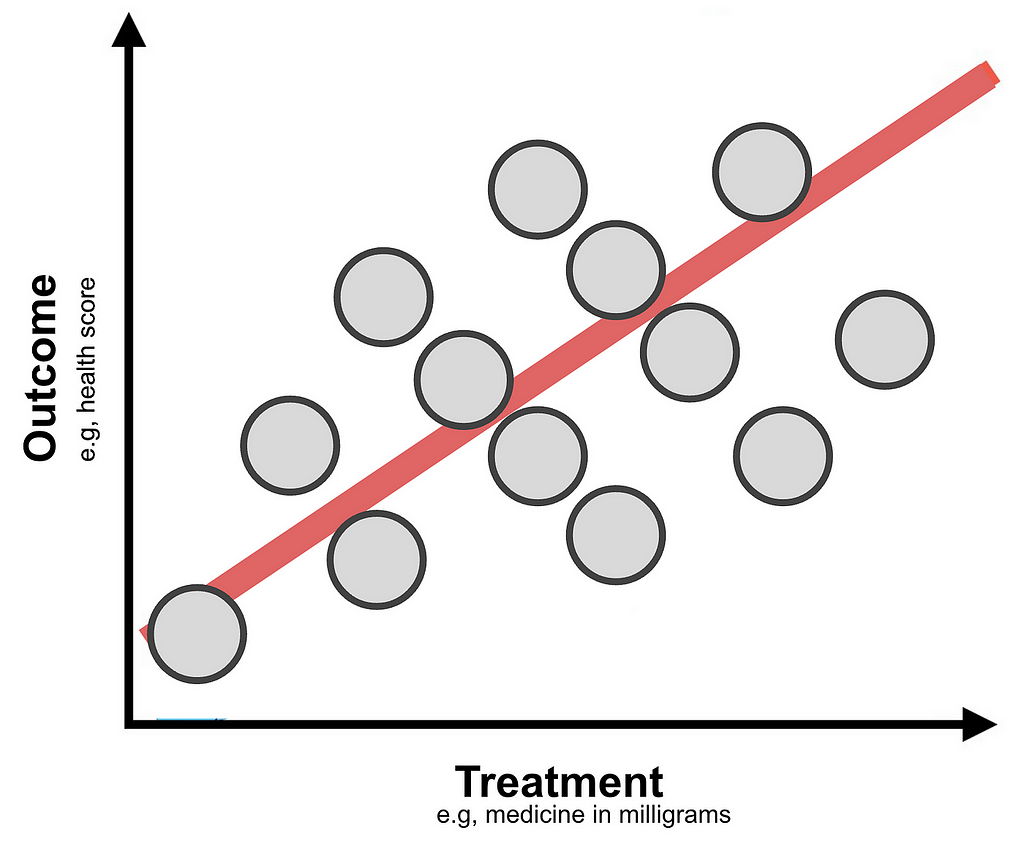
In the figure above it appears that on average increasing the treatment is beneficial since it results in a better outcome.
Now we’ll colour code by age and gender groupings and examine how increases in the treatment impacts the outcome of each cohort.
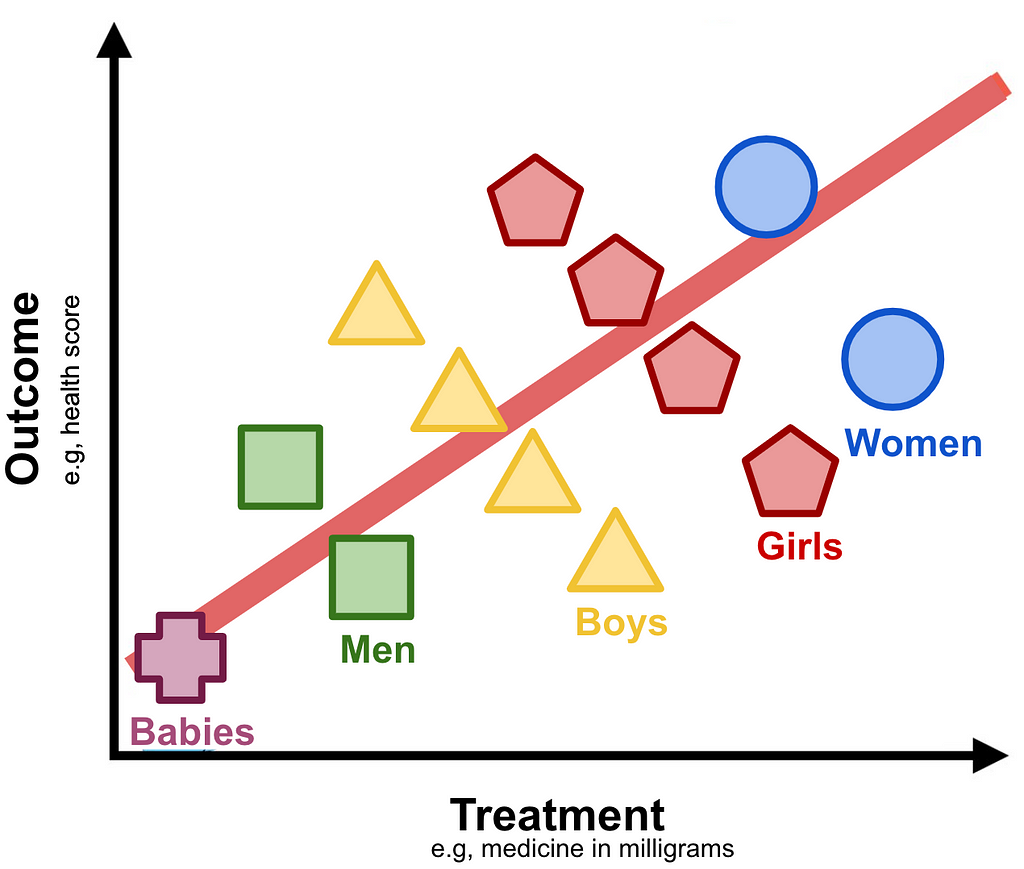
Track any cohort (e.g, “Girls” representing young females) and you immediately realise that increase in treatment appears to have an adverse effect on the outcome.
What should be the conclusion of the study?
On the one hand increasing the treatment appears to be better for the population at large, but when examining gender-age cohorts it seems disadvantageous.
This counter intuitive example is the essence of Simpson’s paradox.
This particular case is actually referred to as Lord’s Paradox formulated by Frederic M. Lord in 1967². It is effectively Simpson’s only with different variable types. As you can see here the Treatment and Outcome are continuous variables. Simpson’s paradox, as originally formulated by Edward H. Simpson in 1951³, is the same in essence when both have categorical values.
In some circles these are referred in general as the Reversal Paradoxes where the name depends on the variables types⁴. Later we shall see that this name is misleading as it limits their actual scope which is beyond reversal.
In order to distinguish differences in the graphs presented in this section to those in the next I will refer to the one presented here with continuous treatment and outcome variables as Lord’s Paradox.
To conclude this section about Lord’s paradox, I want to share this beautiful illustration of what it might look like in a real world setting.
In what follows we will examine a case of Simpson’s Paradox with treatment and outcome having binary values. We shall see that the maths are quite straightforward to follow.
A Quantitative Dive Into Simpson’s Paradox
Disclaimer: This section is for the bravehearted ⚔️. If at any stage you find this too confusing 🫠, feel free to skip to the section called “Visualising The Paradox With A Graph Model” where I focus on a qualitative intuition.
Let’s imagine a different imaginary (but plausible) pharmaceutical study where a company is conducting a clinical trial for a new drug. The objective of this project is to assess the effectiveness of this cure to improve recovery rates of sick patients. As mentioned earlier, for simplicity we assume that samples are representative.
The setup and results are:
- 2,000 sick patients are equally distributed into control and treatment groups. The control group gets a placebo and the treatment group gets the new pill.
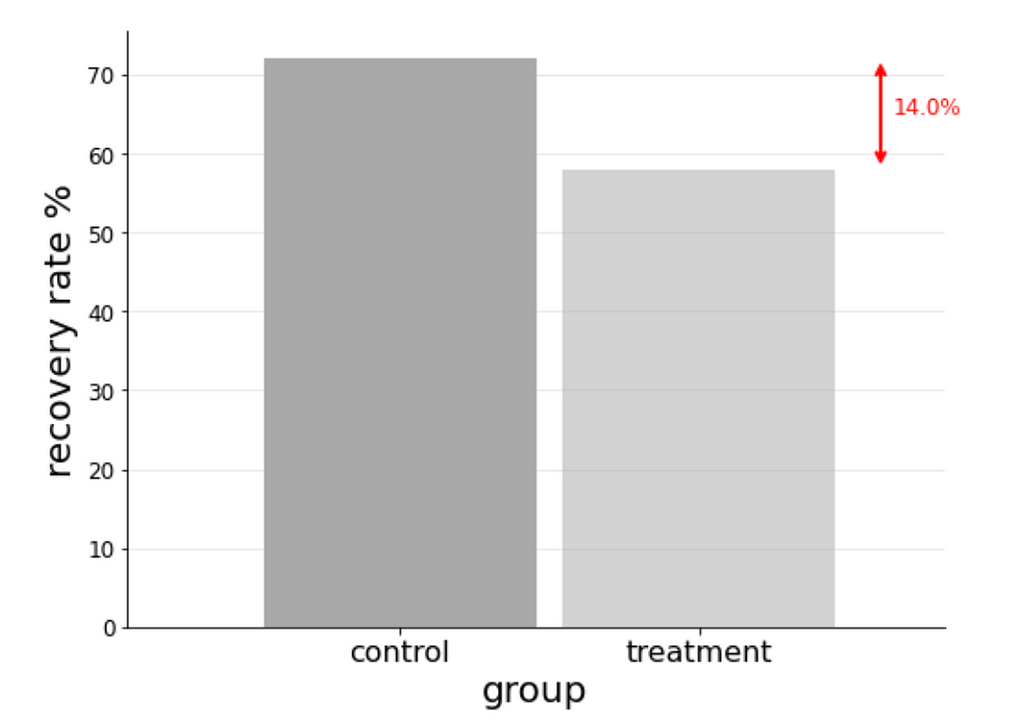
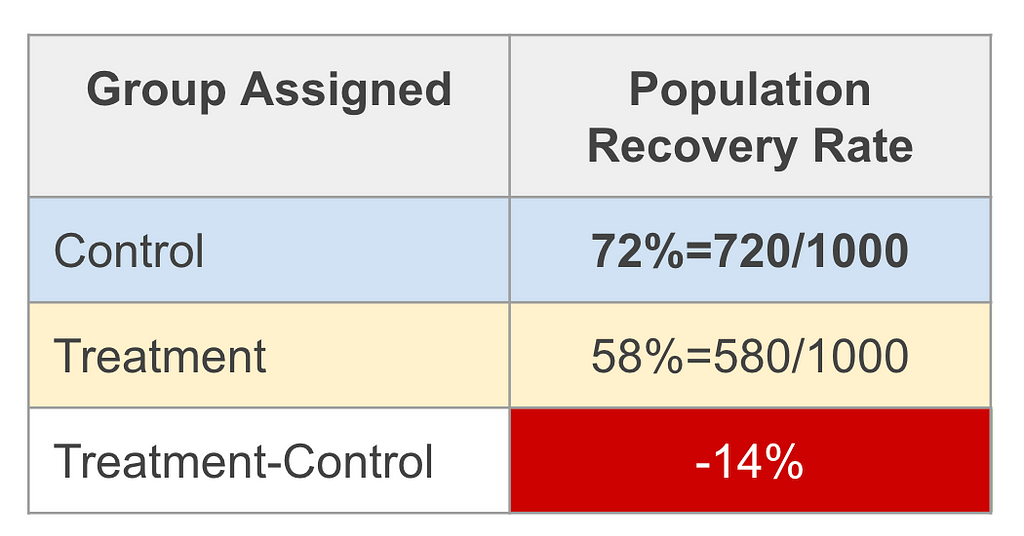
- 72% of the control group recovered.
- 58% of the treatment group recovered.
Finding: The recovery rate of the treatment group is 14% less of that of the control group.⁵
The naïve assessment would be that the cure has an adverse effect, quoting 14% lower recovery rates.
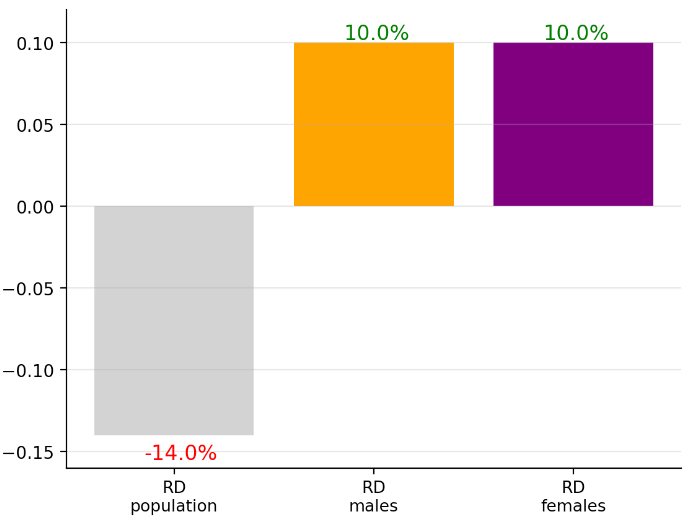
To drive home this interpretation you can imagine a slide presented in a in a boardroom meeting showing a chart like this:
And in the analysis material a table like this:
To add a bit of formality in describing the objective metric we define the Risk Difference as the difference of the rate of recovery of the treatment group (treatment=T) minus that of the control group (treatment=F):
RD = P(recovery=T∣treatment=T) − P(recovery=T∣treatment=F)
Note that here treatment is short of “is in treatment group?”, F is short for False and T for True. The conditional probabilities P(x|y) notations read as: probability of x conditioned on y. E.g, P(recovery=T∣treatment=F) means the probability of recovery of the control group. Als to guide the eye we boldface the treatment values T (treatment group) and F (control group) as these are the only values difference when subtracting the conditional probabilities.
The result we quote here is RDᵖᵒᵖ=-14%. (Throughout we use the term population or pop to refer to the study population rather than the general population.)
The astute decision maker (clinical researcher or executive) would not be satisfied and correctly request for a breakdown using parameters that may have an impact on the outcome. For simplicity we will limit our exploration into gender, assuming only it is important.
Male Results
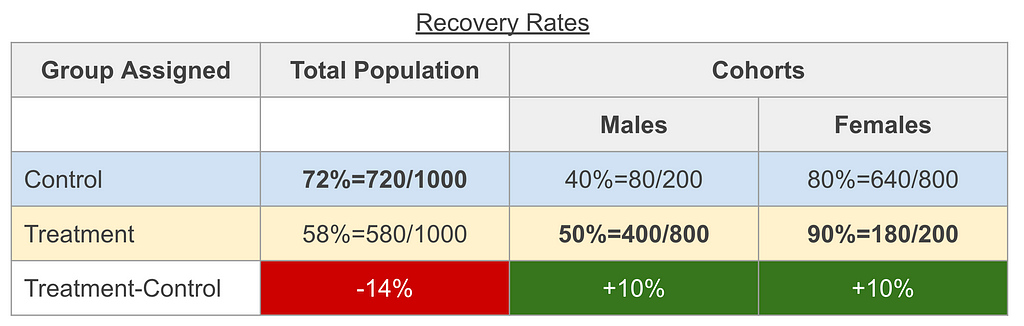
- 40% of the control group recovered
- 50% of the treatment group recovered
Female Results
- 80% of the control group recovered
- 90% of the treatment group recovered
Findings:
- The male cohort risk difference is RDᵐᵃˡᵉ=10%
- The female cohort risk difference is RDᶠᵉᵐᵃˡᵉ=10%
- The female cohort recovery rates are overall higher than that of the male cohort (both in the treatment group 90% female cohort vs. 50% male cohort and in control group 80% female cohort vs. 80% male cohort).
By chance the assessment for these results is that the drug is beneficial for each gender cohort quoting a risk difference of RDᵐᵃˡᵉ=10%, RDᶠᵉᵐᵃˡᵉ=10%. (This is not necessarily required for the paradox, but was cherry picked 🍒 as it simplifies the maths and visuals.)
This is in clear contradiction to when we naïvely concluded for the study population RDᵖᵒᵖ=-14%.
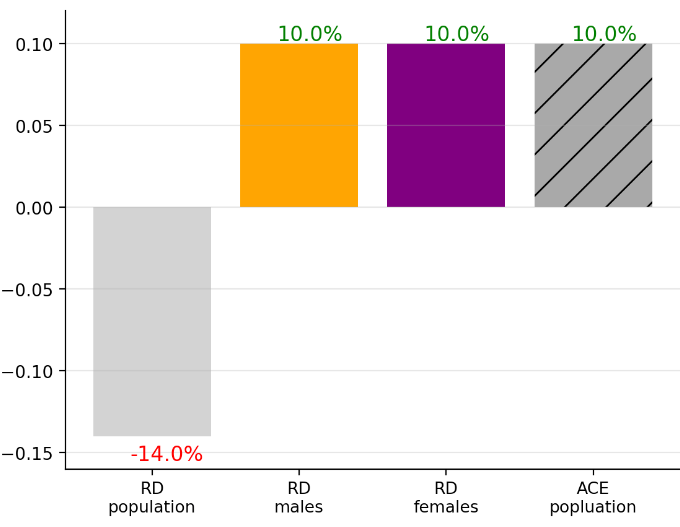
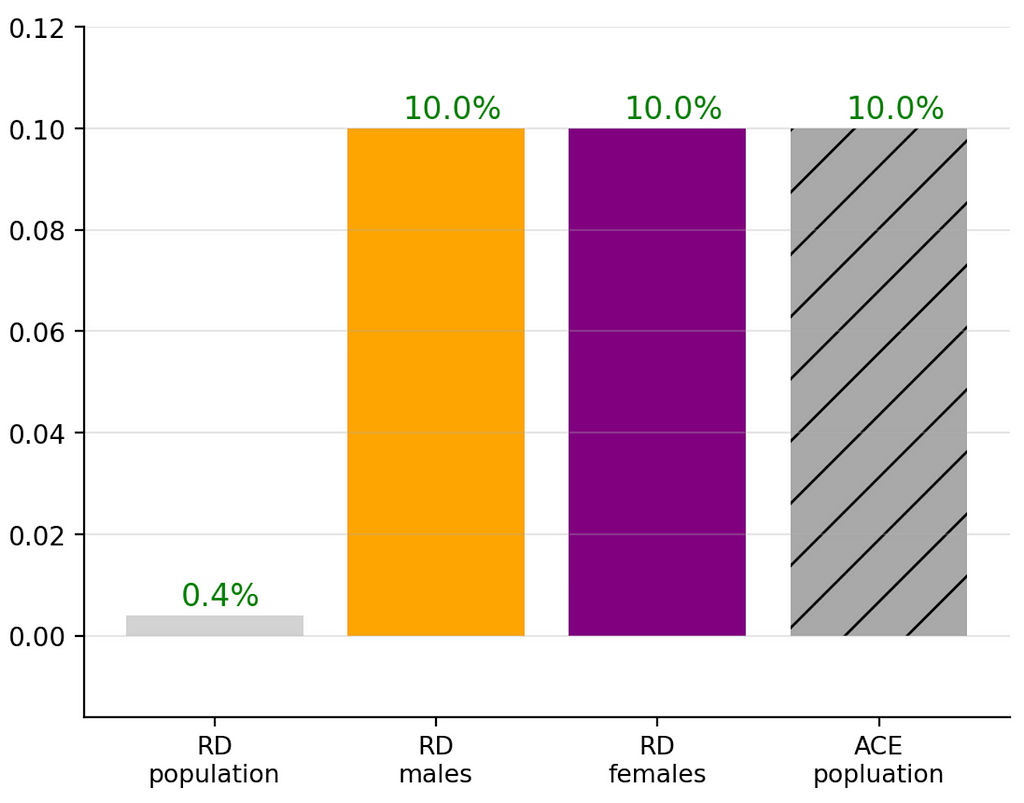
This visual acutely shows this contrast:
A detailed table would look like this:
To fully appreciate this confusing situation, I suggest triple checking the numbers and comparing to the charts before continuing.
This is the same mind boggling contradiction as what we’ve seen in Lord’s paradox: the same data yields opposite trends based on how it’s examined.
How does one make a conclusion?
The solution might be apparent to some if not most readers (and it’s totally fine if not it’s not apparent to you; with experience one gets used to these situations): We need to control for the gender as it is a confounder.
But what does “gender is a confounding variable” mean in practice and … why?
Let’s dig a bit deeper to understand why Simpson’s Paradox arises and the solution will be über apparent.
Simpson’s paradox in apparent this data due to two aspects:
- Even though the population was equally split into control and treatment groups (1,000 each), the gender cohorts were not. In other words: The group assignment variable depended on one’s gender.
- The recovery rates depend on gender.
For the first point we copied the table above now highlighting the issue of group assignment depending on gender.
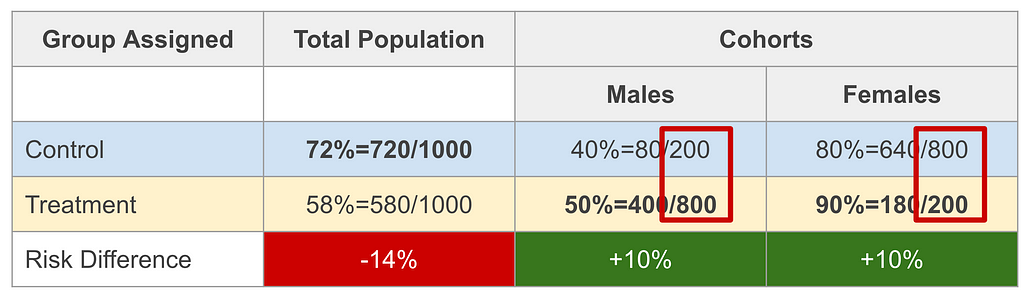
We see that a male was 20% likely to be in the control group and 80% likely to get a treatment. For females it is in reverse. This may be written as:
- P(treatment=F|male=T) = 0.2, P(treatment=T|male=T) = 0.8,
- P(treatment=F|male=F) = 0.8, P(treatment=T|male=F) = 0.2,
Just a reminder that here treatment is short of “is in treatment group?” and male is short for “is male?”.
This is necessary but not sufficient for Simpson’s paradox to be apparent. The second condition of the recovery rate depending on the gender is also required.
Examining the table above again, you will notice that males in the treatment group recovered 50% of the time and females 90%. A similar gap in rates is in the control groups.
It’s hard to juggle all this logic in the head, so let’s examine a visual that will make this more intuitive.
On the top panel are the results of the control group and on the bottom of the treatment. In each panel we display on the horizontal axis the recovery rate and on the vertical axis the number of participants within each group. The red lines indicate the group rates of recovery, respectively (72% for control and 58% for treatment).
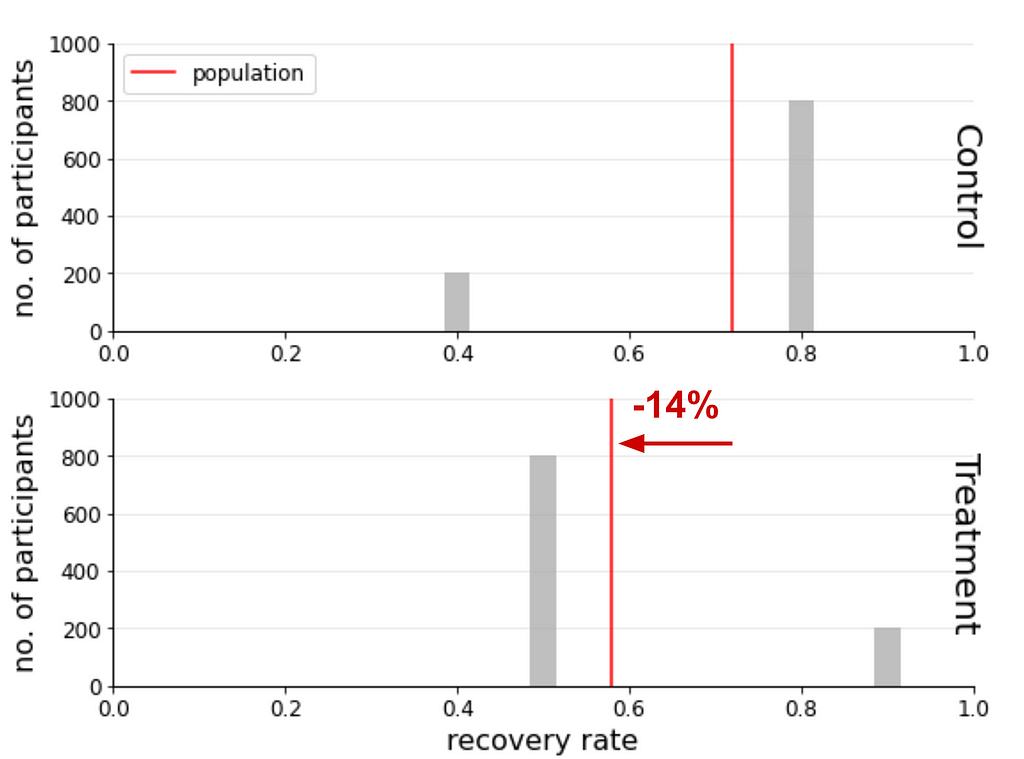
The conclusion that RDᵖᵒᵖ=-14% (the treatment group recovered less than the control group by 14%) is apparent from this visual. You are probably wondering why there are grey bars and why I haven’t been described.
The reason is to emphasise that they weren’t used to calculate RDᵖᵒᵖ, but I leave them there because they are crucial to understand where the confusion arises and resolved. Each bar shows the recovery rate and number of participants for one of the gender cohorts within the control and treatment groups. In each panel the red lines are the average of these bars and are used to calculate RDᵖᵒᵖ.
In the next illustration we colour the bars (ignoring the red lines which are not used in the cohort calculations):
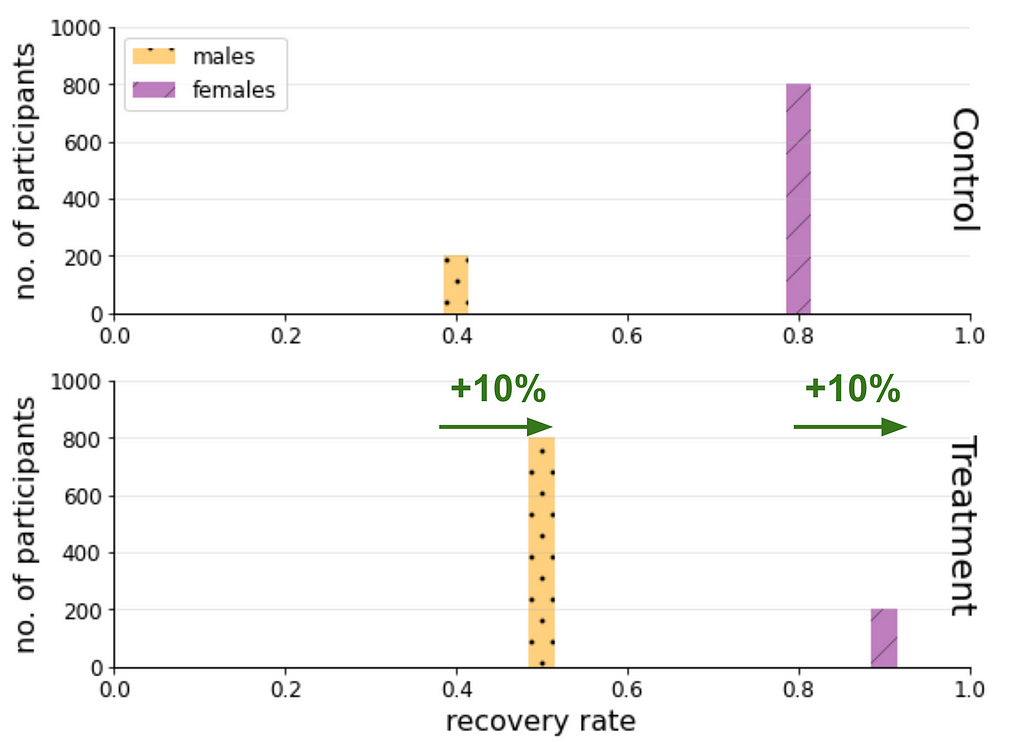
From these two last figures we see how the RDᵐᵃˡᵉ=10%, RDᶠᵉᵐᵃˡᵉ=10% (for each gender cohort the treatment group recovers 10% more than the control group.) are related to the “reverse” apparent effect RDᵖᵒᵖ=-14%.
In the next section we will examine a heuristic that is more appropriate to describe the risk difference of the study population.
Analytical Solution To Simpson’s Paradox
In order to discuss a metric that is appropriate for the study population we copy equations from above and formulate some that we used implicitly.
Recall how we defined the Risk Difference:
RD = P(recovery=T∣treatment=T) − P(recovery=T∣treatment=F)
For brevity for what follows we will shorten to:
RD = P(R=T∣T=T) − P(R=T∣T=F),
i.e, recovery as in “has recovered?” → R , treatment as in “in treatment group” → T. We will also shorten “is male?” → M.
Naïvely applying for the full study population we obtained RDᵖᵒᵖ=-14%.
When applying for the gender cohorts we conditioned on them:
RDᵐᵃˡᵉ = P(R=T∣T=T, M=T) − P(R=T∣T=F, M=T)
RDᶠᵉᵐᵃˡᵉ = P(R=T∣T=T, M=F) − P(R=T∣T=F, M=F)
When plugging in the study figures we obtain RDᵐᵃˡᵉ=10%, RDᶠᵉᵐᵃˡᵉ=10% which is a reverse trend to RDᵖᵒᵖ=-14%.
The source of the problem is that we didn’t control for gender.
This means that we can report for each gender independently: RDᵐᵃˡᵉ=10%, RDᶠᵉᵐᵃˡᵉ=10%. This is fine, but it is also useful to quote a summary metric for the study.
In causality we discuss the Average Causal Effect (ACE) which is also called the ATE where the T stands for treatment which is may be calculated as the weighted average of all the cohorts of the confounder being controlled for:

In our case the cohorts are the two genders, and hence:
ACE=P(male=T)RDᵐᵃˡᵉ + P(male=F)RDᶠᵉᵐᵃˡᵉ
For this binary case this requires one additional value — the probability of the population to be male P(male) (where for females is the complementary). This, of course, depends on the circumstance. If we would like to extrapolate to a larger population, that would depend on the context (e.g, might vary per country, and/or age).
We will stick to the study population data and use P(male=T)=50%.
Plugging in all the values we obtain ACEᵖᵒᵖ=10%, the as expected from the weighted average of RDᵐᵃˡᵉ and RDᶠᵉᵐᵃˡᵉ. (Note that it is equal to them in this cherry picked 🍒 for simplicity.)
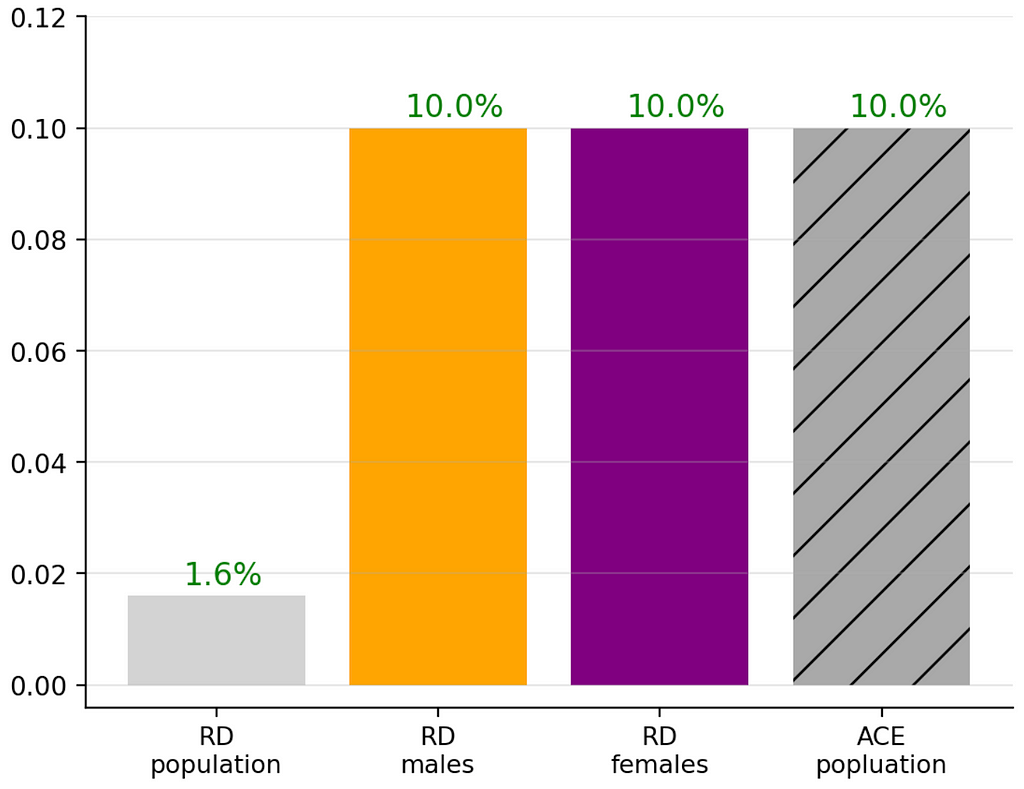
Let’s visualise the bar chart again now adding the ACEᵖᵒᵖ.
Whereas this might appear trivial, I encourage you to play with data to see more interesting, less straightforward situations. In the next section you’ll see how and discuss some interesting other data setups.
Further Insights From Playing With Data
Being confused at this stage is OK 😕
At first I struggled to understand this concept. It took me three weekends of deep diving into examples to internalise it.
For me understanding this was the gateway to understanding causality.
Part of my process to understanding statistics is playing with data. For this purpose I created an interactive web application which I call Simpson’s Calculator 🧮.
To reduce the length of this post I don’t go into details of this app, but will emphasise insights I got from it. I think its quite self-explanatory, but please ping me if you feel it warrants a separate post.
The calculator provides you will the same mock data analysed here where you have full control over all the conditional probabilities 🎛. This enables you to examine different scenarios and by so quickly gain insights. The default state of this calculator are the values in the table above.
My favourite insight was noticing that when I shifted the male treatment group percentage P(treatment=T|male=T) from the default 80% to 37% (which altered the rest of the complementary probabilities to maintain the population size of 2,000) I obtained the following:
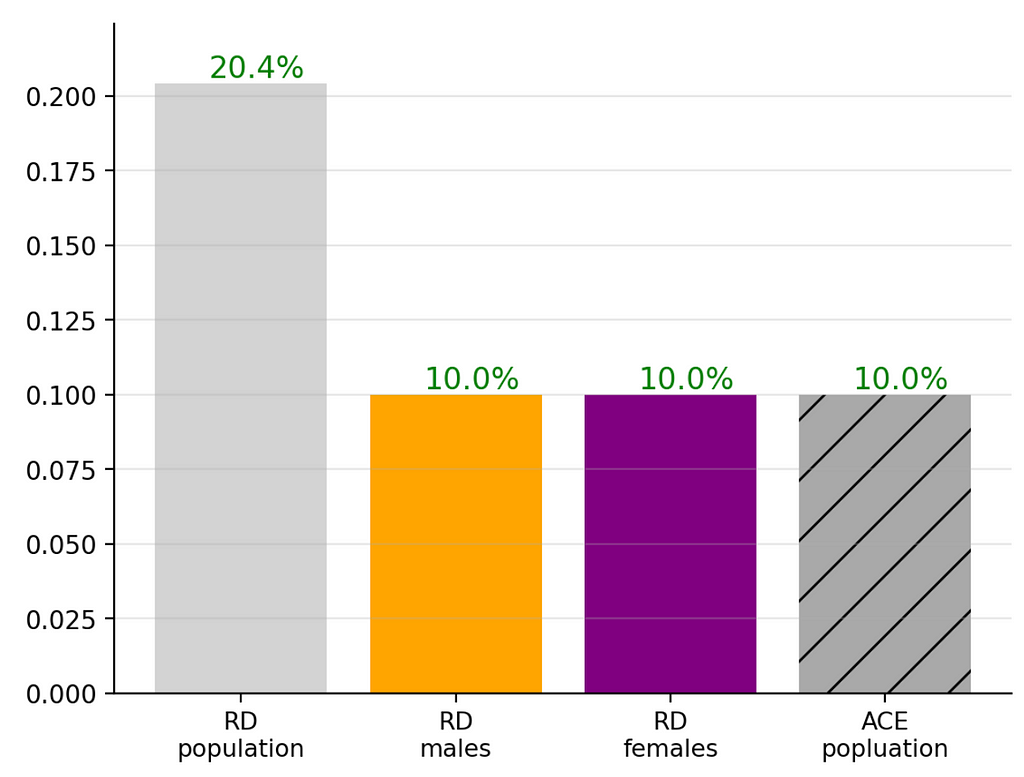
As you can see RDᵐᵃˡᵉ, RDᶠᵉᵐᵃˡᵉ and ACEᵖᵒᵖ remain constant, but only RDᵖᵒᵖ is sensitive to the change of this distribution. The interesting aspect is that the change did not cause RDᵖᵒᵖ to be a reversal but rather an apparent boost to the RDᵐᵃˡᵉ, RDᶠᵉᵐᵃˡᵉ .
Imagine the spins a marketing department of this made-up pharma company could conduct based on this misleading RDᵖᵒᵖ value. This clearly shows that decision makers who focus only on RDᵖᵒᵖ are fooling not only themselves but anybody that depends on their decision making!
I didn’t see mention of this in the textbooks I was reading at the time, so I was quite excited about this find.
Reversal, Enhancement, Diminishment, Oh My!
While preparing this article I found that Tu, Gunnell & Gilthorpe (2008)² discuss this enhancement effect. From their abstract:
[The statistical paradoxes] share the same characteristic: the association between two variables can be reversed, diminished, or enhanced when another variable is statistically controlled for.
They also point out a diminishing effect.
In the Simpson’s Calculator 🧮 setting this diminishment may be obtained by setting changing the male treatment proportion from 80% to P(treatment=T|male=T)=62% (and holding everything else in the default setting fixed):
Alternatively conserving all default settings and updating the recovery rates of the male treatment and recovery groups from 50% and 40% to P(R=T∣T=T, M=T)=76%, P(R=T∣T=F, M=T)=66% (i.e, conserving RDᵐᵃˡᵉ=10%), which yields:
In both these cases the RDᵖᵒᵖ is positive but diminished compared to the more meaningful RDᵐᵃˡᵉ, RDᶠᵉᵐᵃˡᵉ and ACEᵖᵒᵖ.
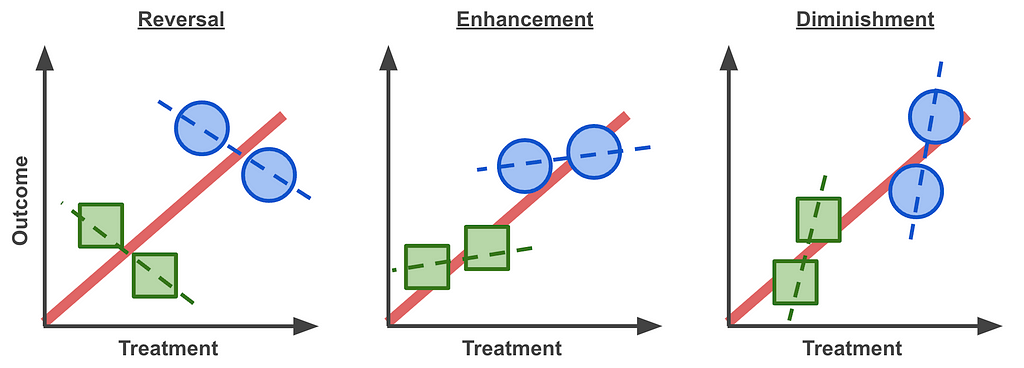
This means that we should update the commonly used phrase that we started with to the following:
“Trends can exist in subgroups but reverse or enhanced or diminished for the whole”
This may be summarised in with these Lord’s Paradox graphs, where the different symbols represent different cohorts and their trends marked as dashed lines:
For those who went through the deep dive — good on ya’! 👏 I’d be keen to learn if the length is justified or could somehow be broken down.
The above quantitative approach to understanding the paradox is based on a common explanation I came across when I started my journey in causality. I added a few of the graphs and insights that I felt were missing to try to paint a clearer picture.
We next turn to a qualitative point of view to understand how we can assess this phenomena in systems before even looking at data.
Visualising The Paradox With A Graph Model
Whereas the above is an important quantitative thought process to understand Simpson’s Paradox, graph models visualise the essence of the problem and solution in a concise qualitative way.
[From the Simpson’s Paradox we learn that] certain decisions cannot be made based on the basis of data alone, but instead depend on the story behind the data. … Graph Theory enables these stories to be conveyed — Judea Pearl
To build this intuition, here we will construct a graph model step by step.
We start by defining the relationships between the parameters and then draw these into a graph where nodes are the parameters and arrows indicate causality: “who listens to whom?”.
In the examples examined (Lord’s and Simpson’s paradoxes) we saw that:
- Gender is an independent variable (i.e, does not depend on Treatment or Outcome)
- Treatment depends on Gender
- The Outcome (or recovery rate) depends on Gender and Treatment
The most subtle relationship is the second one. Remember that in Simpson’s paradox only 20% of the males were in the control group and 80% in the treatment group P(T=T|M=T) = 0.8. For the females it was the opposite P(T=T|M=F) = 0.2.
Those with a sharp eye may have seen a similarity in the Lord’s Paradox example. For simplicity of the discussion below we’ll examine it focusing on two cohorts, male and female adults:
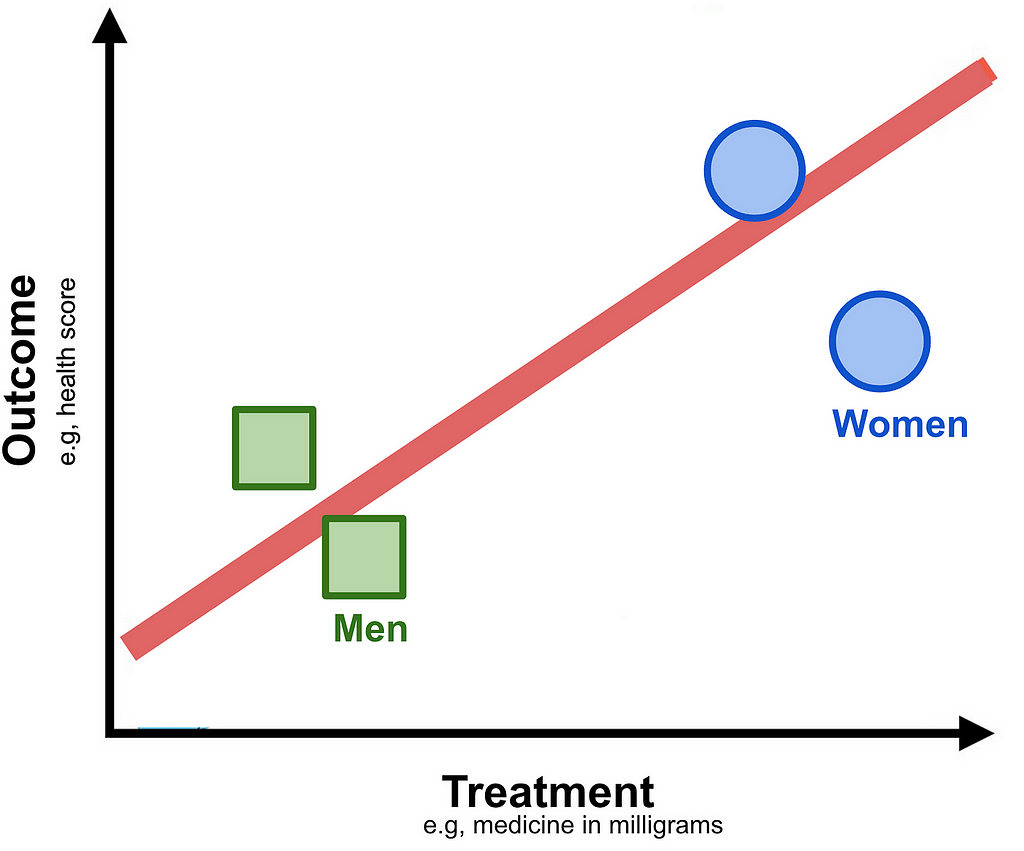
If you ignore the Outcome axis and project data points to the Treatment axis and you will notice that the Women cohort, for some reason not provided, have been given a higher dosage.
Now that we have defined the relationships between the parameters we are ready to draw the graph model which applies both to the Simpson’s and Lord’s paradox setups:
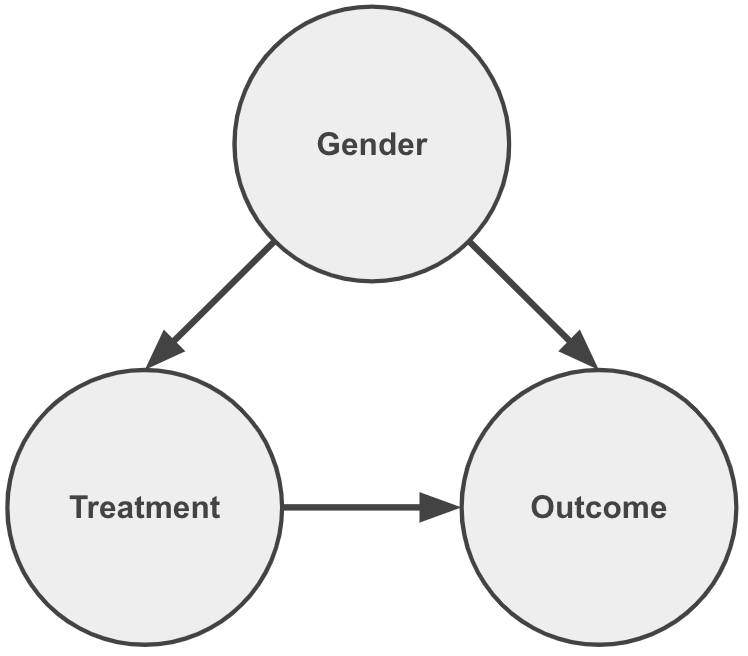
Notice how each arrow contributes to communicating the statements above. As important, the lack of an arrow pointing into Gender conveys that it is an independent variable.
We also notice that by having arrows pointing from Gender to Treatment and Outcome it is considered a common cause between them.
The essence of the paradox is that although the Outcome is affected by changes in Treatment, as expected, there is also a backdoor path flow of information via Gender.
Whereas the graph above describes the problem. The following graph describes the solution of controlling for the common cause:
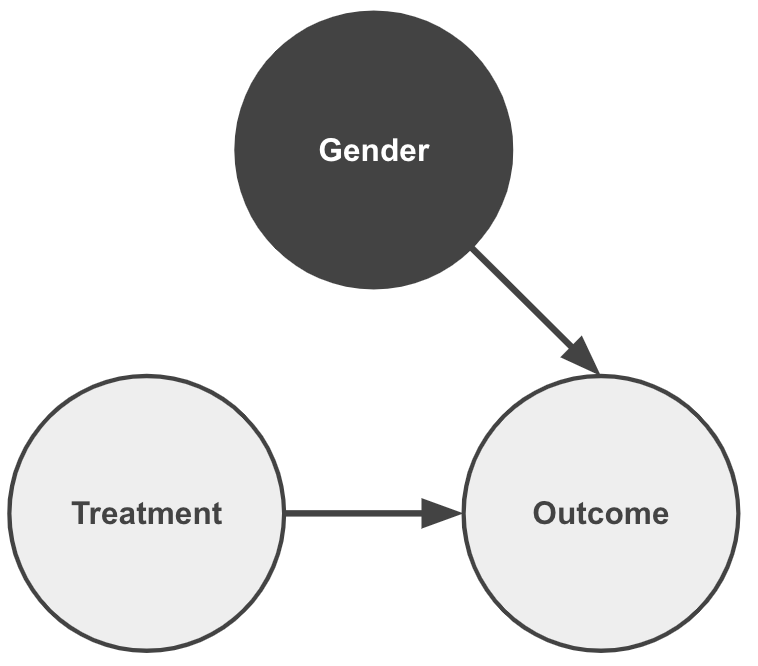
This is effectively a graph surgery of the dependency of the Treatment on Gender, and by so eliminating the problematic backdoor path.
When we calculated the ACE in the quantitative discussion we effectively applied this graph surgery. This is useful when one is limited to “observational data” in which the experiment designers did not consider the impact of Gender being a common cause.
If they would have controlled for Gender a priori this last graph would fully represent the case. (In the first continuous example that would mean providing Male and Female cohorts the same Treatment levels; In the second binary example that would mean distributing Males and Females in a similar manner to the control and treatment groups.)
The process of controlling for a confounder, i.e manipulation of the data generation process, is formally referred to as applying an intervention. That is to say we are no longer passive observers of the data, but we are taking an active role in modifying it to assess the causal impact.
In my previous post ➡️ Start Asking Your Data “Why?” ¹ I discuss more in depth about the importance of visualising the story behind the data with graph models. Most relevant to here I elaborate on using graph models to justify controlling of parameters.
🔎 You’ll Never Look At Data The Same
I haven’t.
And I have been addicted ever since.
Every time that I learn about a system I try to draw a graph model to identify the possibility for this paradox.
This is one of the main challenges in causality — ensuring that one’s graph model does not contain Simpson’s Paradox (as it is colloquially called or the Yule-Simpson effect). I will discuss more about this in a future post of mine about applicability of causality in real world projects, so stay tuned … 📻
You might justifiably question why I dragged you through the quantitative examples if there is a qualitative explanation. I feel that both approaches are complementary where each aspect helps solidify an understanding of the other ☯️. For example in the quantitative explanation we saw that, even though the paradox is commonly referred to as a “reversal of trends”, it is not limited to that. We’ve explored examples of boosting and diminishing effects.
Now tell me — will you ever look at data the same?
Welcome to the club 😃.
I hope that you have enjoyed what I consider, at least for myself, the gateway to understanding causality 🪜. It is an intellectually stimulating and rewarding journey 🛣️.

At the end of my previous post¹ I highlight the first steps in the causal journey.
My next suggested one— try to understand why this graph is not Simpson’s Paradox:
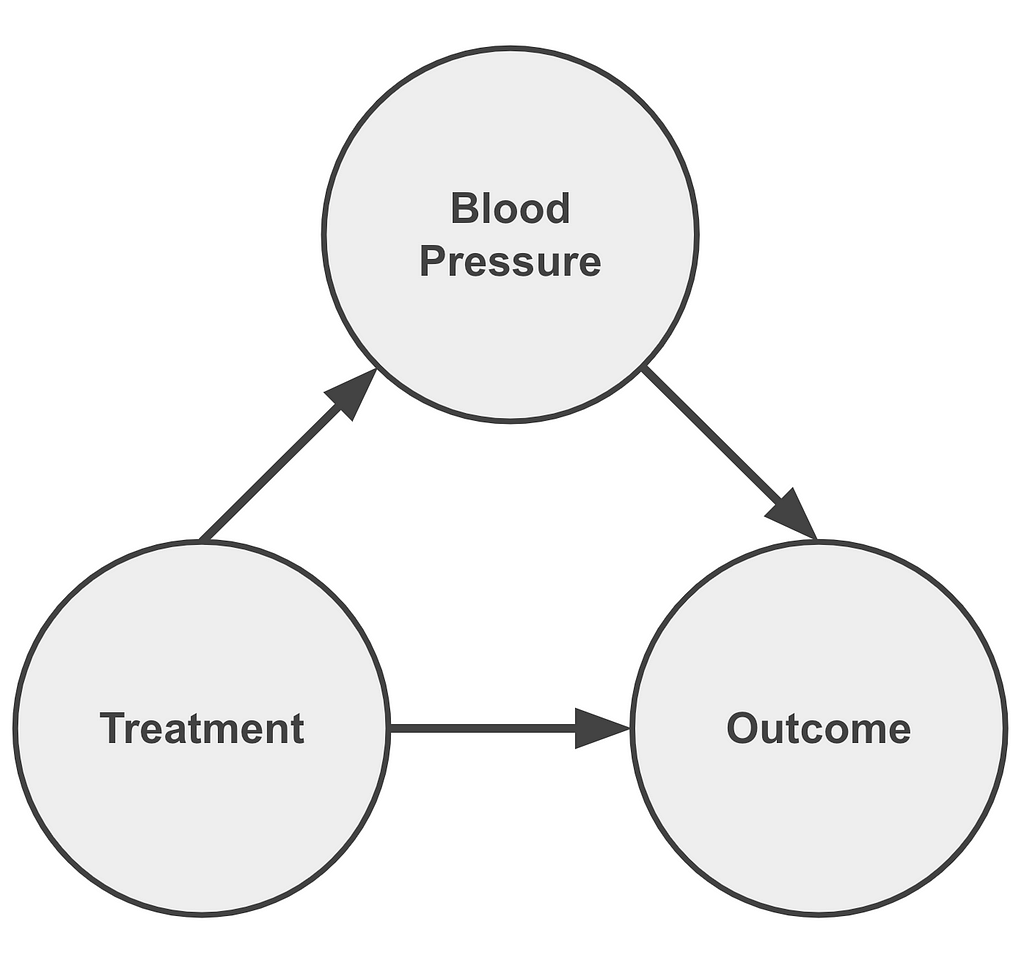
Feel free to leave your answers and insights in the comments section.
Unless otherwise noted, all images were created by the author.
Footnotes
¹ In the post ➡️ Start Asking Your Data “Why?” — A Gentle Intro To Causality I describe Simpson’s Paradox along with Berkson’s in a qualitative manner to convey the message of the importance of visualising the story behind the data. In particular I emphasise causality requires justifying when we should (and shouldn’t!) control for parameters. I also provide links to resources that I found useful to start my journey in causality: books 📚, courses 🔏, software 💾.
➡️ Start Asking Your Data “Why?” - A Gentle Intro To Causality
² Simpson, Edward H. (1951). “The Interpretation of Interaction in Contingency Tables”. Journal of the Royal Statistical Society, Series B. 13 (2): 238–241.
Note that the paradox was also mentioned by
- G. U. Yule (1903). “Notes on the Theory of Association of Attributes in Statistics”. Biometrika. 2 (2): 121–134,
as well as - Karl; Lee, Alice; Bramley-Moore, Lesley (1899). “Genetic (reproductive) selection: Inheritance of fertility in man, and of fecundity in thoroughbred racehorses”. Philosophical Transactions of the Royal Society A. 192: 257–330.
³ Lord, E. M. (1967). “A paradox in the interpretation of group comparisons.” Psychological Bulletin, 68, 304–305.
⁴ Tu, Gunnell & Gilthorpe (2008): “Simpson’s Paradox, Lord’s Paradox, and Suppression Effects are the same phenomenon — the reversal paradox” Emerg Themes Epidemiol 5, 2 (2008)
⁵ Percentages throughout are quoted in absolute terms comparing treatment to control, not relative.
The Story Behind This Post
This narrative is a result of two study groups that I have conducted in a previous role to get myself and colleagues to learn about causality, which I felt was missing in my skill set. If there is any interest I’m glad to write a post about the study group experience.
This explanation of Simpson’s Paradox was created as the one the I sensed that I needed when I started my journey in causality.
Here are links to two recordings of me presenting this in online conferences:
You might notice that in the videos that I admit that I am likely to be foolish to spend 10 minutes one such a confusing topic as Simpson’s Paradox. Overall I think the feedback was positive about my choice of presentation. I hope that you feel the same way.
The slides are available at bit.ly/start-ask-why.
Eyal Kazin | Simpson’s Paradox | Causality was originally published in Towards Data Science on Medium, where people are continuing the conversation by highlighting and responding to this story.
from Datascience in Towards Data Science on Medium https://ift.tt/bUe6rE2
via IFTTT


