
Getting Started with Powerful Data Tables in your Python Web Apps
Getting Started with Powerful Data Tables in Your Python Web Apps
Using AG Grid to build a Finance app in pure Python with Reflex
These past few months, I’ve been exploring various data visualization and manipulation tools for web applications. As a Python developer, I often need to handle large datasets and display them in interactive, customizable tables. One question that consistently bothered me was: How can I build a powerful data grid UI that integrates seamlessly with my Python backend?
There are countless options out there to build sophisticated data grids, but as a Python engineer, I have limited experience with JavaScript or any front-end framework. I was looking for a way to create a feature-rich data grid using only the language I’m most comfortable with — Python!
I decided to use Reflex, an open-source framework that lets me build web apps entirely in Python. What’s more, Reflex now offers integration with AG Grid, a feature-rich data grid library designed for displaying and manipulating tabular data in web applications which offers a wide array of functionalities including:
- In-place cell editing
- Real-time data updates
- Pagination and infinite scrolling
- Column filtering, reordering, resizing, and hiding
- Row grouping and aggregation
- Built-in theming
Disclaimer: I work as a Founding Engineer at Reflex where I contribute to the open-source framework.
In this tutorial we will cover how to build a full Finance app from scratch in pure Python to display stock data in an interactive grid and graph with advanced features like sorting, filtering, and pagination — Check out the full live app and code.
Setup
First we import the necessary libraries, including yfinance for fetching the stock data.
import reflex as rx
from reflex_ag_grid import ag_grid
import yfinance as yf
from datetime import datetime, timedelta
import pandas as pd
Fetching and transforming data
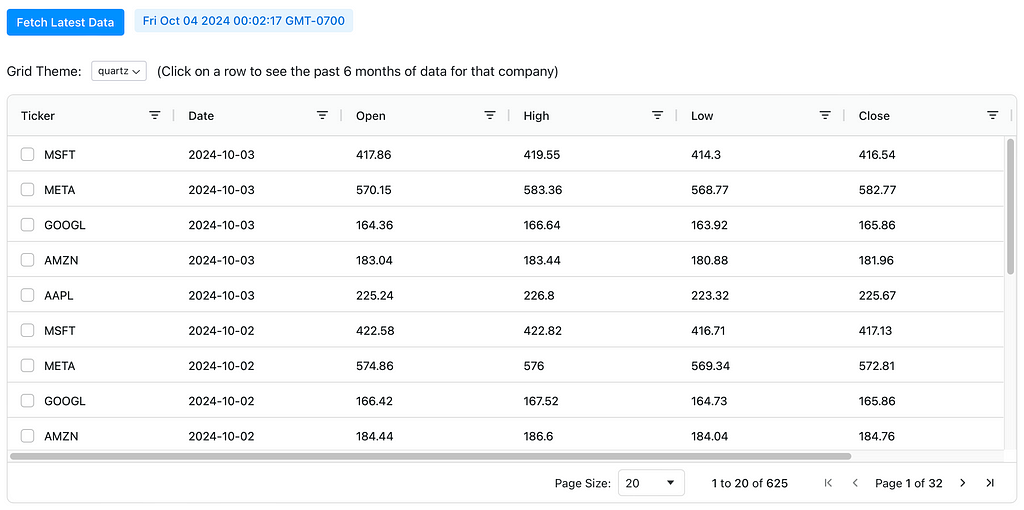
Next, we define the State class, which contains the application’s state and logic. The fetch_stock_data function fetches stock data for the specified companies and transforms it into a format suitable for display in AG Grid. We call this function when clicking on a button, by linking the on_click trigger of the button to this state function.
We define state variables, any fields in your app that may change over time (A State Var is directly rendered into the frontend of the app).
The data state variable stores the raw stock data fetched from Yahoo Finance. We transform this data to round the values and store it as a list of dictionaries, which is the format that AG Grid expects. The transformed data is sorted by date and ticker in descending order and stored in the dict_data state variable.
The datetime_now state variable stores the current datetime when the data was fetched.
# The list of companies to fetch data for
companies = ["AAPL", "MSFT", "GOOGL", "AMZN", "META"]

class State(rx.State):
    # The data fetched from Yahoo Finance
    data: pd.DataFrame
    # The data to be displayed in the AG Grid
    dict_data: list[dict] = [\{}]
    # The datetime of the current fetched data
    datetime_now: datetime = datetime.now()

    def fetch_stock_data(self):
        self.datetime_now = datetime.now()
        start_date = self.datetime_now - timedelta(days=180)

        # Fetch data for all tickers in a single download
        self.data = yf.download(companies, start=start_date, end=self.datetime_now, group_by='ticker')
        rows = []
        for ticker in companies:
            # Check if the DataFrame has a multi-level column index (for multiple tickers)
            if isinstance(self.data.columns, pd.MultiIndex):
                ticker_data = self.data[ticker]  # Select the data for the current ticker
            else:
                ticker_data = self.data  # If only one ticker, no multi-level index exists

            for date, row in ticker_data.iterrows():
                rows.append({
                    "ticker": ticker,
                    "date": date.strftime("%Y-%m-%d"),
                    "open": round(row["Open"], 2),
                    "high": round(row["High"], 2),
                    "mid": round((row["High"] + row["Low"]) / 2, 2),
                    "low": round(row["Low"], 2),
                    "close": round(row["Close"], 2),
                    "volume": int(row["Volume"]),
                })

        self.dict_data = sorted(rows, key=lambda x: (x["date"], x["ticker"]), reverse=True)
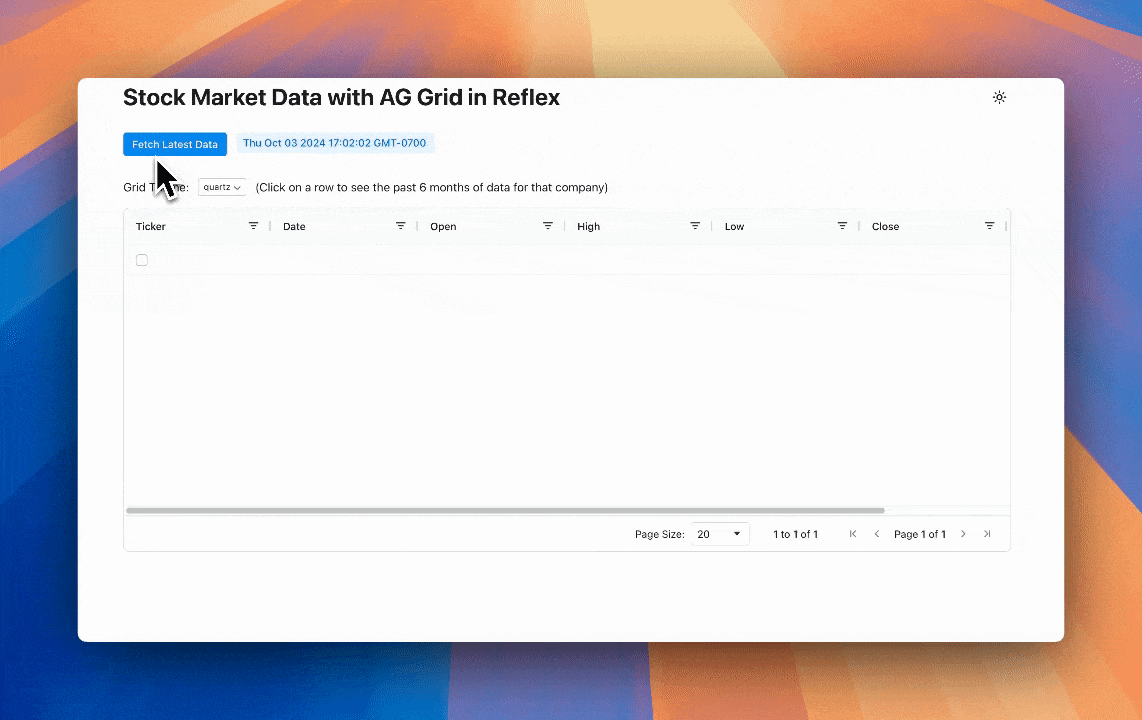
rx.button(
    "Fetch Latest Data",
    on_click=State.fetch_stock_data,
)
Defining the AG Grid columns

The column_defs list defines the columns to be displayed in the AG Grid. The header_name is used to set the header title for each column. The field key represents the id of each column. The filter key is used to insert the filter feature.
column_defs = [
    ag_grid.column_def(field="ticker", header_name="Ticker", filter=ag_grid.filters.text, checkbox_selection=True),
    ag_grid.column_def(field="date", header_name="Date", filter=ag_grid.filters.date),
    ag_grid.column_def(field="open", header_name="Open", filter=ag_grid.filters.number),
    ag_grid.column_def(field="high", header_name="High", filter=ag_grid.filters.number),
    ag_grid.column_def(field="low", header_name="Low", filter=ag_grid.filters.number),
    ag_grid.column_def(field="close", header_name="Close", filter=ag_grid.filters.number),
    ag_grid.column_def(field="volume", header_name="Volume", filter=ag_grid.filters.number),
]
Displaying AG Grid
Now for the most important part of our app, AG Grid itself!
• id is required because it uniquely identifies the Ag-Grid instance on the page
• column_defs is the list of column definitions we defined earlier
• row_data is the data to be displayed in the grid, which is stored in the dict_data State var
• pagination, pagination_page_size and pagination_page_size_selector parameters enable pagination with specific variables in the grid
• theme enables you to set the theme of the grid
ag_grid(
    id="myAgGrid",
    column_defs=column_defs,
    row_data=State.dict_data,
    pagination=True,
    pagination_page_size=20,
    pagination_page_size_selector=[10, 20, 50, 100],
    theme=State.grid_theme,
    on_selection_changed=State.handle_selection,
    width="100%",
    height="60vh",
)
Changing AG Grid Theming
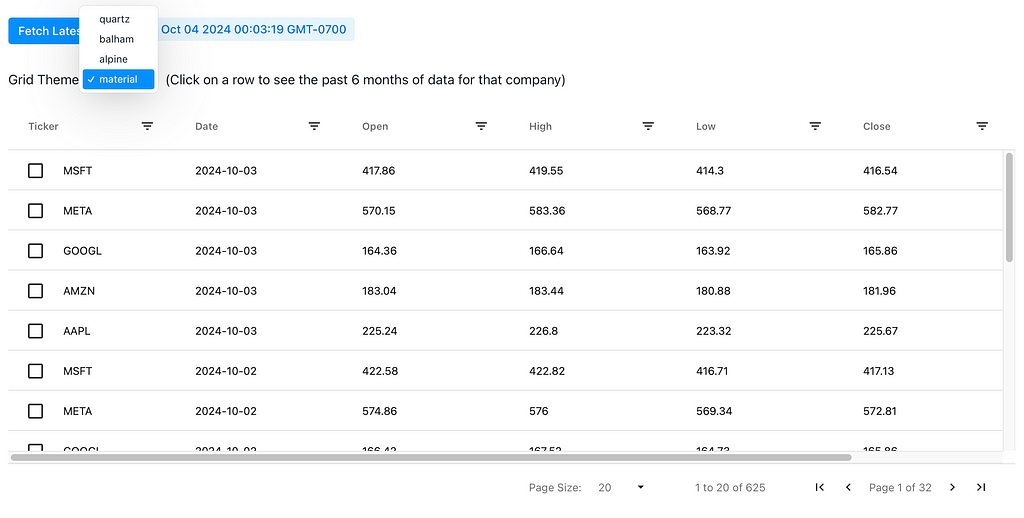
We set theme using the grid_theme State var in the rx.select component.
Every state var has a built-in function to set it’s value for convenience, called set_VARNAME, in this case set_grid_theme.
class State(rx.State):
    ...
    # The theme of the AG Grid
    grid_theme: str = "quartz"
    # The list of themes for the AG Grid
    themes: list[str] = ["quartz", "balham", "alpine", "material"]

rx.select(
    State.themes,
    value=State.grid_theme,
    on_change=State.set_grid_theme,
    size="1",
)
Showing Company Data in a Graph
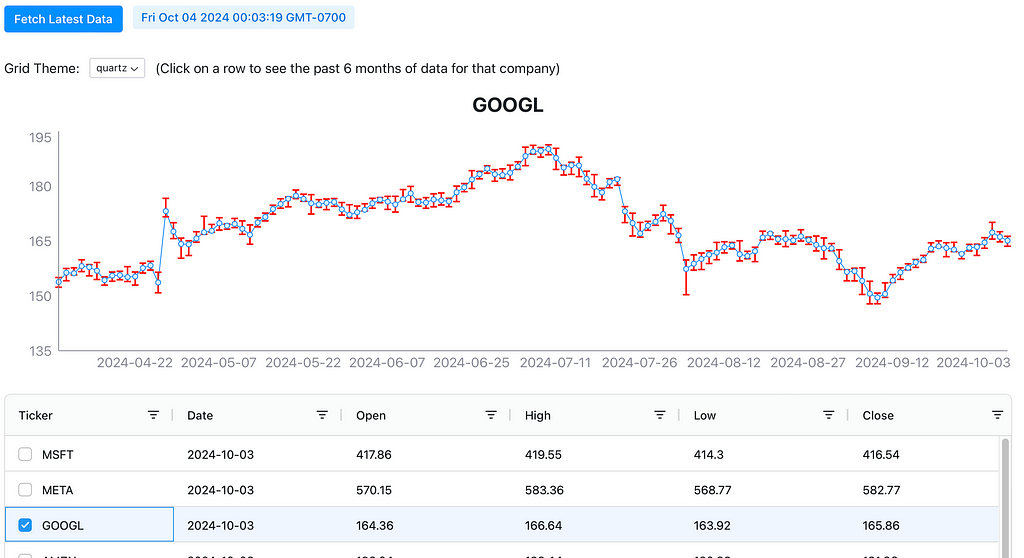
The on_selection_changed event trigger, shown in the AG grid code above, is called when the user selects a row in the grid. This calls the function handle_selection method in the State class, which sets the selected_rows state var to the new selected row and calls the function update_line_graph.
The update_line_graph function gets the relevant ticker and uses it to set the company state var. The Date, Mid, and DateDifference data for that company for the past 6 months is then set to the state var dff_ticker_hist.
Finally it is rendered in an rx.recharts.line_chart, using rx.recharts.error_bar to show the DateDifference data which are the highs and the lows for the day.
class State(rx.State):
    ...
    # The selected rows in the AG Grid
    selected_rows: list[dict] = None
    # The currently selected company in AG Grid
    company: str
    # The data fetched from Yahoo Finance
    data: pd.DataFrame
    # The data to be displayed in the line graph
    dff_ticker_hist: list[dict] = None

    def handle_selection(self, selected_rows, _, __):
        self.selected_rows = selected_rows
        self.update_line_graph()

    def update_line_graph(self):
        if self.selected_rows:
            ticker = self.selected_rows[0]["ticker"]
        else:
            self.dff_ticker_hist = None
            return
        self.company = ticker

        dff_ticker_hist = self.data[ticker].reset_index()
        dff_ticker_hist["Date"] = pd.to_datetime(dff_ticker_hist["Date"]).dt.strftime("%Y-%m-%d")

        dff_ticker_hist["Mid"] = (dff_ticker_hist["Open"] + dff_ticker_hist["Close"]) / 2
        dff_ticker_hist["DayDifference"] = dff_ticker_hist.apply(
            lambda row: [row["High"] - row["Mid"], row["Mid"] - row["Low"]], axis=1
        )

        self.dff_ticker_hist = dff_ticker_hist.to_dict(orient="records")


rx.recharts.line_chart(
    rx.recharts.line(
        rx.recharts.error_bar(
            data_key="DayDifference",
            direction="y",
            width=4,
            stroke_width=2,
            stroke="red",
        ),
        data_key="Mid",
    ),
    rx.recharts.x_axis(data_key="Date"),
    rx.recharts.y_axis(domain=["auto", "auto"]),
    data=State.dff_ticker_hist,
    width="100%",
    height=300,
)
Conclusion
Using AG Grid inside the Reflex ecosystem empowered me as a Python developer to create sophisticated, data-rich web applications with ease. Whether you’re building complex dashboards, data analysis tools, or an application that demands powerful data grid capabilities, Reflex AG Grid has you covered.
I’m excited to see what you’ll build with Reflex AG Grid! Share your projects, ask questions, and join the discussion in our community forums. Together, let’s push the boundaries of what’s possible with Python web development!
If you have questions, please comment them below or message me on Twitter at @tgotsman12 or on LinkedIn. Share your app creations on social media and tag me, and I’ll be happy to provide feedback or help retweet!
Getting Started with Powerful Data Tables in your Python Web Apps was originally published in Towards Data Science on Medium, where people are continuing the conversation by highlighting and responding to this story.
from Datascience in Towards Data Science on Medium https://ift.tt/XW3QFTV
via IFTTT


