
How to Export a Stata “Notebook” to HTML
Create a shareable HTML document with your code, outputs, and graphs
When collaborating on data projects, sharing your work effectively is crucial. While sending over commented code might suffice in some cases, there are times when this just isn’t enough.
I will be honest here and say that I don’t enjoy working with Stata. I find it incredibly counterintuitive from a programming perspective because of its syntax. But my main problem with it is that it isn’t clear the best way to share your work if it isn’t by sharing the data and the do file, so the other person can run it by themselves.
If both of you are working with the code, that’s fine. However, many times, the other person just wants to see the results and understand how you achieved them. Running the code themselves can be time-consuming at best and a logistical challenge at worst.
Despite this, I still need to work with this Stata, as it is widely used in economic research.
But now I have discovered the best way to solve this problem. And it is by using the webdoc command.
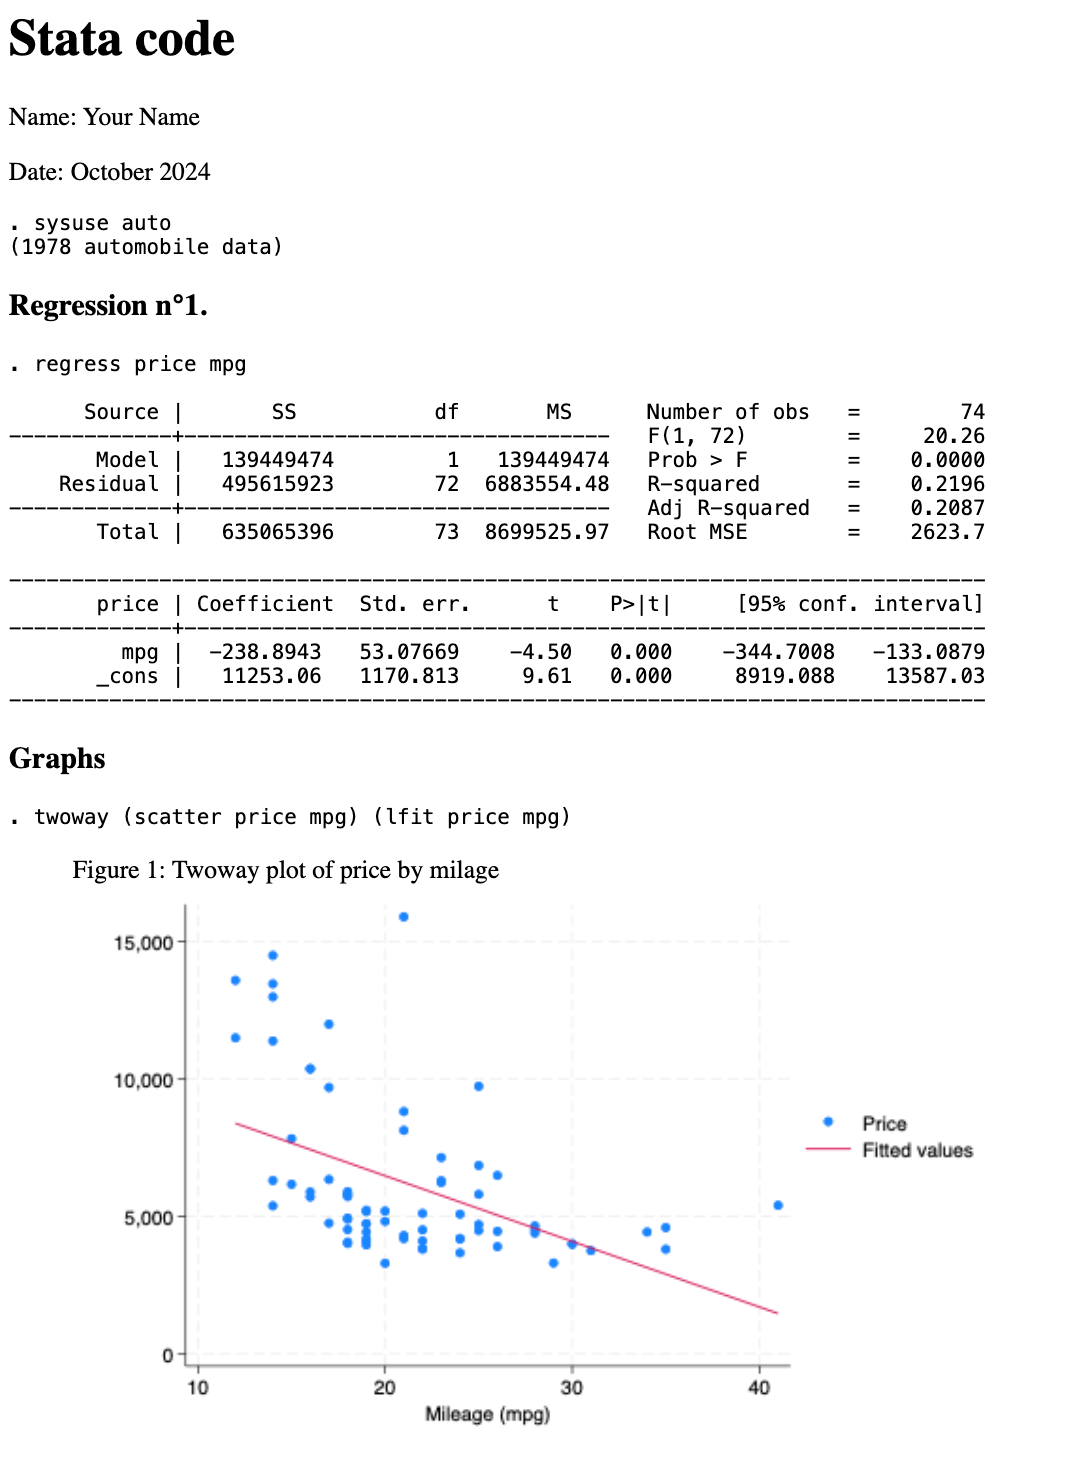
After going through this article you will be able to turn your code, for example, this:
* Stata code
* Name: Your Name
* Date: October 2024

clear all
cd "your/directory/"

sysuse auto

* Regression n°1
regress price mpg

* Graphs
      twoway (scatter price mpg) (lfit price mpg)
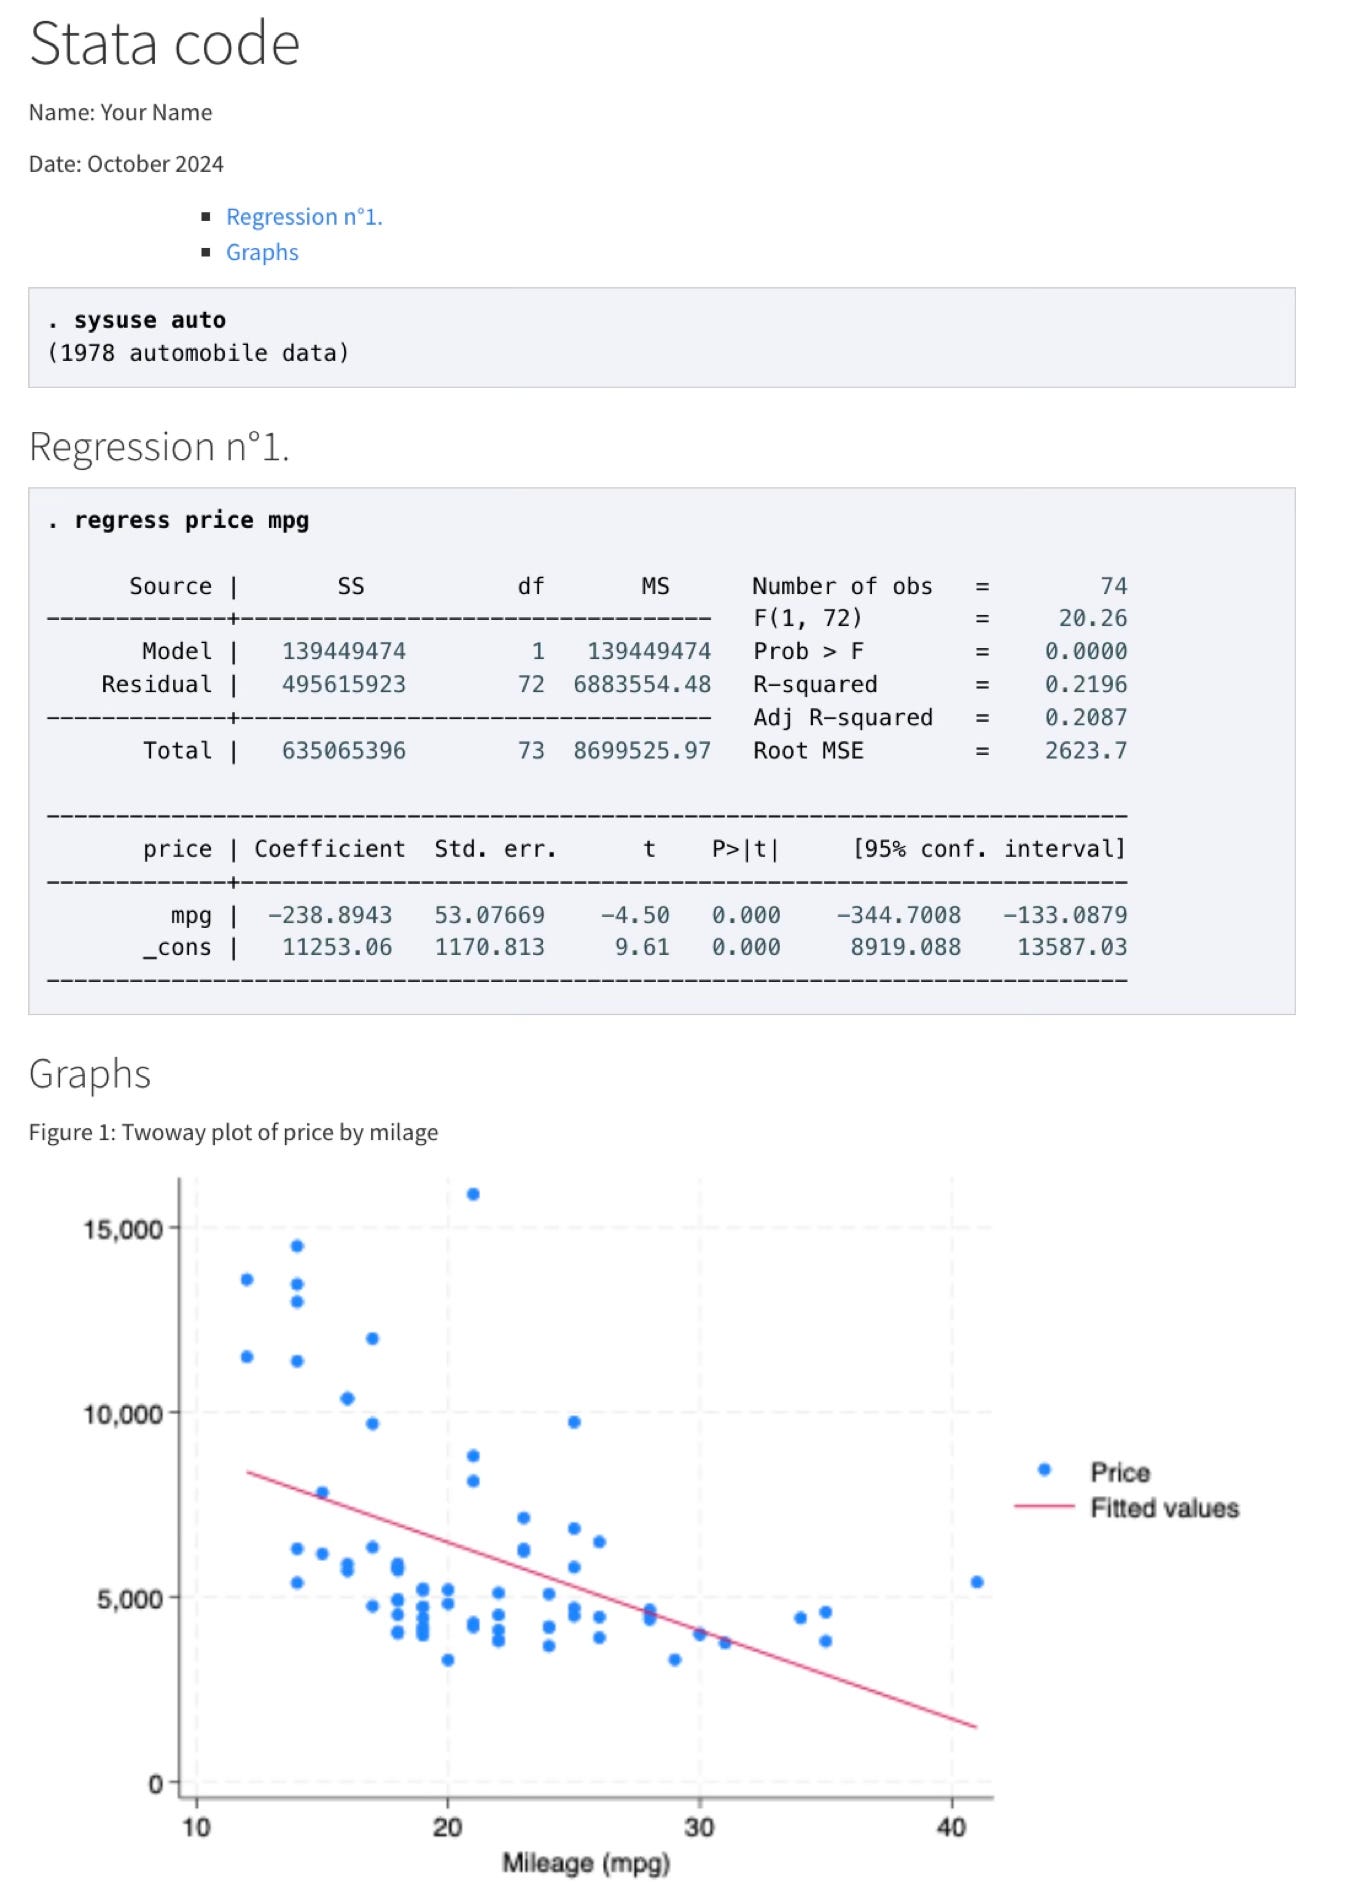
Into a shareable HTML document that looks like this:
Now imagine all the possibilities!
In this article, I will be covering the following points:
- What is webdoc?
- How to install webdoc
- How to start using webdoc
- Using Markdown instead of HTML
- Adding a table of contents
- Formatting your HTML document (a.k.a. making it look nice 😎)
I will be covering what I believe to be te basics tools you can start using right away to share your work effectively. However, you can dive even deeper by looking at the official documentation [1] for this command, which is also available on a web format here.
Now, let’s dive in!
1. What is webdoc
webdoc is a Stata community-contributed command designed to process a do-file that contains Stata commands as well as pieces of HTML or Markdown code.
The primary purpose of webdoc is to generate an HTML document that displays Stata output as it appears in the Results window of the software.
However, it can also create Markdown documents if you are more familiar with that markup language. Later on, you could convert the Markdown into an HTML by using another software like pandoc, to share it more easily with others.
2. How to Install webdoc
To be able to use the webdoc command in Stata, you will need to install it first by running the following line in the Stata console:
ssc install webdoc, replace
To check for updates, you can type:
adoupdate webdoc
With webdoc installed, let’s move on to creating your first do-file that includes both Stata code and HTML comments.
3. How to Start Using webdoc
The basic idea is to create a file called a do-file. This file should have Stata commands and sections of HTML code. Then, we can process the do-file using the command webdoc do.
Let’s follow the example code I provided above. First, we’ll set up the do-file at the beginning by using the webdoc init command. Then, every comment you want to appear as text in the HTML final document, you will write as /*** text ***/. Here’s how we’ll do it:
webdoc init example, replace logall

/***
<html>
<head><title>Example</title></head>
<body>

<h1> Stata code </h1>

<p> Name: Your Name <p>
<p> Date: October 2024 <p>
***/

sysuse auto

/*** <h3> Regression n°1. </h3> ***/

regress price mpg

/*** <h3> Graphs </h3> ***/

twoway (scatter price mpg) (lfit price mpg)
webdoc graph, caption(Figure 1: Twoway plot of price by milage) cabove ///
title(price by mpg) attributes(width="100%")

/***
</body>
</html>
***/
I also added the webdoc graph command to include the scatter plot just created by Stata on the code line above.
Finally, to process your file, just run on the Stata command pane:
webdoc do example.do
The command will create the HTML source file, which can then be viewed in a browser, and should look something like this:
Up to this point, we have used the logall option, which tells the software to include all the Stata commands and outputs into the final document. But there are some ways to edit this.
The stlog option
Several options are available to webdoc stlog to manipulate the contents to be included in an output section. The ones I use the most are:
- nooutput: this allows you to just show the command you ran, but not the output. This is particularly useful when cleaning the data, or creating new variables.
- nolog: Doing the oposite as the previous one, nolog includes the output but not the command just ran.
For the example we have been following, the second option can be applicable to the graph command. We will edit that section so now it looks like this:
/*** <h3> Graphs </h3> ***/

webdoc stlog, nolog
      twoway (scatter price mpg) (lfit price mpg)
webdoc stlog close

webdoc graph, caption(Figure 1: Twoway plot of price by milage) cabove ///
title(price by mpg) attributes(width="100%")
4. Using Markdown instead of HTML
Now, let’s be honest, having to write HTML in your comments on Stata as you advance in your code is quite a painful experience. You could try opening the document on your code editor of choice, but having to switch between software interfaces can be somewhat troublesome.
This is why I prefer to format the text in Stata by writing using Markdown instead of HTML. It is simpler and quicker to get used to, as there isn’t that much syntax to remember and write.
If you aren’t familiarized with Markdown, I leave you here with a brief introduction to it.
Now, all you need to do is to use the option md with the webdoc init command. For example, you might write at the beginning of your do-file as follows:
webdoc init example, replace logall md
This makes so the suffix .md is used instead of .html for the output file.
Now, you can simply write all the /*** text ***/ using Markdown.
If we transform the previous example into Markdown, we are left with this:
webdoc init example, replace logall md

/***
# Stata code

Name: Your Name

Date: October 2024
***/

sysuse auto

/***
### Regression n°1.
***/

regress price mpg

/***
### Graphs
***/

twoway (scatter price mpg) (lfit price mpg)
webdoc graph, caption(Figure 1: Twoway plot of price by milage) cabove ///
title(price by mpg) attributes(width="100%")
Doesn’t it look a lot cleaner?
Turning your Markdown document into HTML
Once you have created the Markdown document that contains all your comments, code and outputs, you will want to transform it into a shareable HTML document that is a user-friendly way to display your work.
The way I do this is by using pandoc on my terminal. If you have pandoc installed, you can move into the directory that holds the markdown file you want to transform, and then run the following code block:
pandoc example.md -s -o example.html
This will make an HTML document from the “example.md” file.
5. Adding a Table of Contents
Why add a table of contents?
Our main goal by turning our Stata code into a shareable document is to make it easier for the people we work with to access the information that is relevant for them. Because of this, when showcasing a long piece of code, adding a table of contents can be of incredible help to navigate effortlessly through your document.
How to add a table of contents?
To generate a clickable table of contents (TOC) from the headings in your HTML document, you can use the webdoc toc command.
Simply include the command at the desired position in the do-file where you want the TOC to appear. All headings after that position will be collected to construct the TOC. By default, the command collects headings from to <h1> to <h3>.
For webdoc toc to look for Markdown headings, you must specify the md option as follows:
webdoc toc md
6. Formatting the HTML
To edit how your document looks, the more straightforward is by using the header() option that accompanies the webdoc init command.
Here is the code that I used to set up the final HTML document shown at the beginning:
webdoc init example, replace logall md header(title(Stata Code) width(800px) stscheme(ocean) bstheme(cosmo, selfcontained))
The sub-option title()specifies the text for the tag in the HTML document header, and the sub-option width() sets the maximum page width. I like to use 800px for this.
Then come two more sub-options: stscheme() and bstheme(), which I will explain in more detail.
Formatting the Stata output
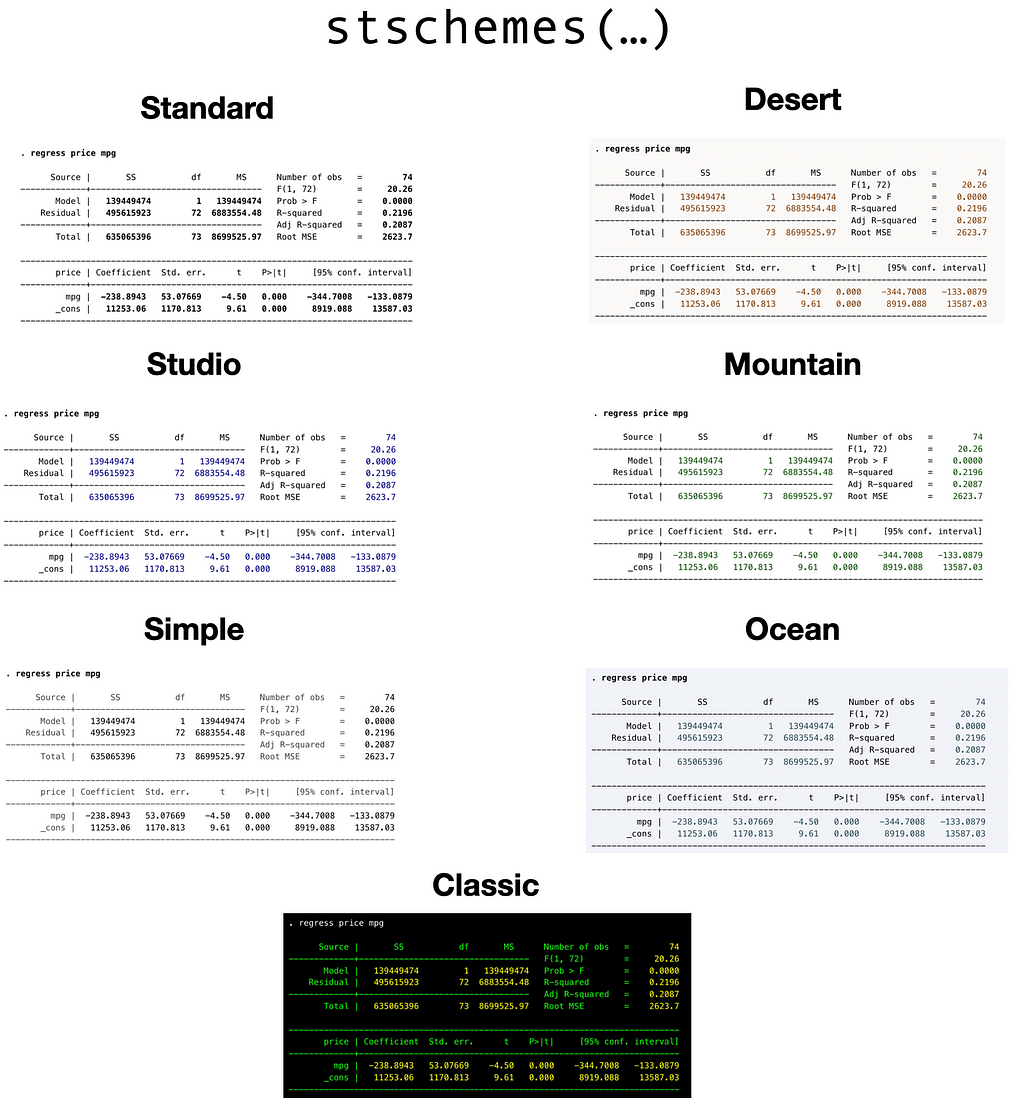
A quick way to start customising the look of your document is by using the sub-option stscheme() inside the header() option. This sub-option can be used to change the theme for the stata outputs, you can choose from: standard, studio, simple, desert, mountain, ocean, and classic.
To give you a better idea, here’s an image that shows how a simple regression looks with each theme.
Using Bootstrap
The next way to modify your document is by using the bstheme() sub-option to include a Bootstrap CSS file. In the example, I used the cosmo theme from bootswatch, but you can use whichever you like the most.
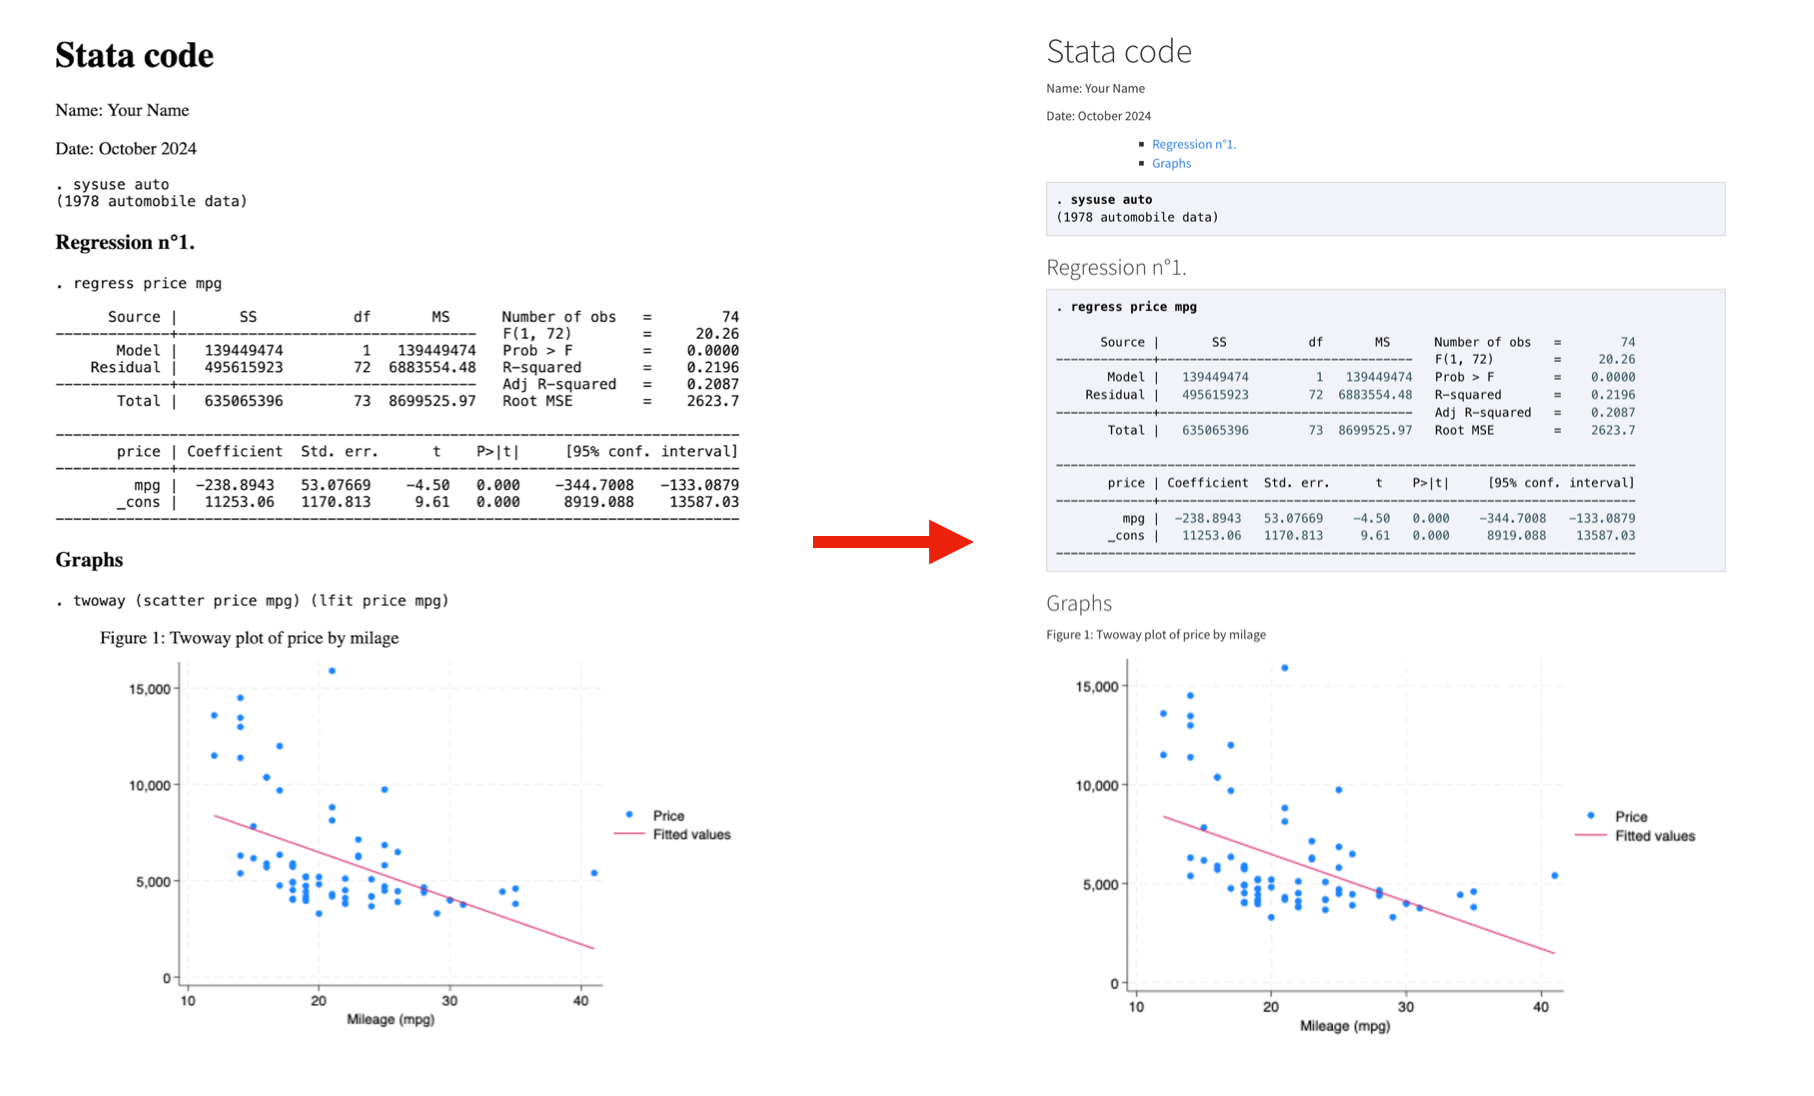
After including all the formatting options we discussed, you should be able to turn the initial HTML document into a nice-to-look-at document as shown below.
Conclusion
Creating a shareable HTML document with webdoc offers a powerful way to present your work in a user-friendly format. Instead of requiring collaborators to run your code, you can now provide them with everything they need — outputs, graphs, and explanations — all in one place.
By using these tools effectively, you’ll save time and make it easier for your team to focus on the results. The next time you’re working on a data project in Stata, try out the webdoc command and take your collaboration to the next level.
References
[1] Jann, Ben (2017). Creating HTML or Markdown documents from within Stata using webdoc. The Stata Journal 17(1): 3–38.
How to Export a Stata “Notebook” to HTML was originally published in Towards Data Science on Medium, where people are continuing the conversation by highlighting and responding to this story.
from Datascience in Towards Data Science on Medium https://ift.tt/tLihJDk
via IFTTT


