
How to Set Bid Guardrails in PPC Marketing
Without controls, bidding algorithms can be quite volatile. Learn how to protect performance through adding guardrails.

Bidding algorithms determine how much to bid for a specific ad placement. In the fast-paced world of digital advertising, where there are hundreds of players competing for an ad-slot and where the referee (i.e. advertising platforms such as Google, Meta, Amazon, etc.) changes rules continuously, these dynamic algorithms are essential. While they are powerful, they are also inherently complex.
The core challenge of bidding lies in the dynamic nature of auctions. Prices can fluctuate rapidly based on factors like user behaviour, time of day, and market demand. Without proper oversight, a bidding algorithm can either overbid, wasting valuable ad spend; or underbid, missing out on critical opportunities. This volatility can lead to either skyrocketing costs with little return or, missed impressions that could have driven significant value.
To prevent these extremes, it’s crucial to implement guardrails that ensure the algorithm operates within reasonable boundaries.
In this blog post, I will share with you a few ideas on how to implement bidding guardrails.
PS 1: The examples you will read in this post come from a couple of the 100s of paid marketing campaigns I was managing at Skyscanner. I have removed all identifiers to protect sharing information, but you will be able to see how the ideas discussed in the article were applied to real data.
PS 2: All images are authored by me, unless otherwise specified.
The more clicks, the better… right?
What is the goal of a bidding algorithm? Well, that depends. In Google Ads you actually have lots of possible targets to optimise for. For simplicity, let’s say that we are in a company who is eager to grow. The goal is, through paid marketing, grow our traffic and hence, our user base. The target is clear: the more clicks the better.
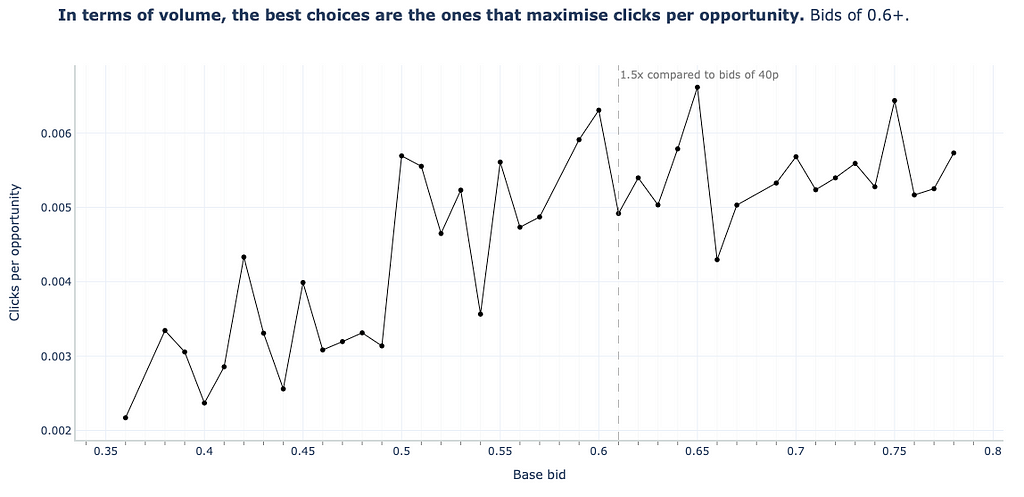
Below, you can see an example of the distribution of clicks per opportunity for a given campaign we managed at Skyscanner.

Whilst a bit jagged, the distribution has a positive trend, meaning that the higher the bid, the higher the potential opportunity. For example, at bids over 60p, we would probably get double the traffic compared to bids of 40p.
Well, case closed: set a lower guardrail at 60p and let the algorithm operate at ranges over this minimum threshold…
Guardrail dimension 1: ROAS
What is ROAS?
But of course it couldn’t be that simple. One of the mantras for paid marketing teams is that “every euro counts”. The company will tell you the goal of click or conversion growth, but always within spend limits. These spend limits are normally defined by the ROAS metric.
ROAS stands for Return on Ad Spend. It is the ratio between the total revenue divided by the total cost of your paid campaigns. For example, if I made €5k directly from my campaigns but had to spend €2.5k, then my ROAS would be 2.
Out of curiosity, you might have also heard the term ROI (Return On Investment). The difference between ROAS and ROI is that ROAS only looks at the revenue gained from a specific ad campaign. ROAS is a short-term measurement — it’s the best metric to use when determining if your advertisements are driving revenue effectively. ROI measures the return from larger marketing and advertising efforts, in other words, measures the cost of doing business. For example, it includes the cost of paying your marketing team or hiring an agency. Working with ROI is slightly more convoluted, so let’s keep our focus on ROAS.
Deciding the guardrails
Anyway, back to our data. At the time of managing the example campaign above, Skyscanner was expanding its growth in specific markets. We were given the following ROAS ranges:
- ROAS < 0.75 = Bad ROAS
- ROAS between 0.75 and 0.85 = Borderline ROAS
- ROAS > 0.85 = Good ROAS
You can see that our ROAS targets allowed for money loss. Some reasons were that we had a longer term ROI view or that growth mode requires upfront investment. With these targets, we were told to ideally be in the “Borderline ROAS” zone. If we did spill into the “Good ROAS” zone it was OK, but then we would reinvest the over performance.
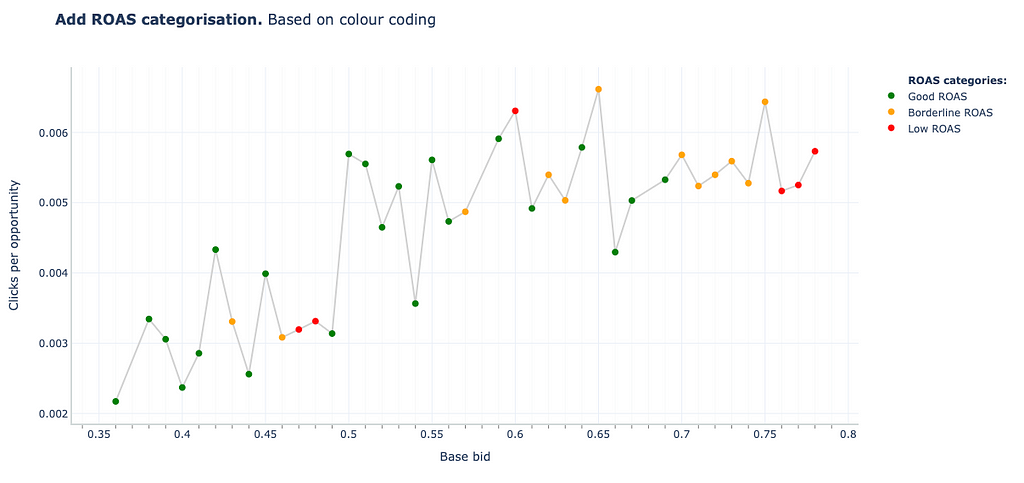
The plot below shows the ROAS at each individual bid point.

To comply with our ROAS limits, we would want to avoid:
- Bids below 42p, as we would be always over performing.
- Bids above 70p, as we would never enter the Good ROAS zone, which is good practice to recover from bad ROAS days.
Guardrail dimension 2: Frequency of tested bids
Don’t you feel something else is missing? I haven’t spoken about how confident we are on the displayed data points. Are we sure we get 1.5x the volume using 60p vs 40p? Are we sure the big ROAS spike of 1.54 for a 64p bid isn’t just a “we were lucky” situation?
Here is where the second guardrail comes into play. In order to get a sense of trustworthiness, I propose looking at how much has a bid been tested. The more days (or impressions) that a bid was exposed to, the more confident you are in the volume that it brings (clicks per opportunity) and the quality of the traffic (ROAS).
The plot below shows how many days was a bid tested in our campaign.

From the distribution above, you can see that our algorithm does not evenly try bids. For example, the 64p bid was tested only 3 days, whereas the 56p bid was tested 13 days!
Deciding the guardrails
It depends on the level of exploration vs exploitation you want. Ideally, you should set guardrails that allow for some wriggle room around high confidence areas. This way, if market conditions change, your algorithm has some room space to explore. If, through exploration, you have gathered enough data to know it an area is truly of low ROAS, then you can adjust your guardrails accordingly.
An idea to decide this exploration space, is to calculate the 90th and 50th percentile of the number of tested days. For example, from the distribution above, our p90 is 11 days, whereas our p50 (or median) is 4 days.
In the plot below, I have painted horizontal lines indicating the 90th and 50th percentiles, representing the number of days the bid was active. The darker the blue colour, the more is has been tested.

With this, your goal could be to collect more data of the “Medium volume” bucket so that it lands in the “High volume” bucket. If that was the case:
- Don’t go below 38p. This is because, there has been a lot of exploitation about the 39p to 42p mark. And that range is already acceptable. No need to explore below the range.
- Don’t go above 70p. Before moving into super high bids, it would be preferable to get the range between 59p to 65p to higher confidence.
Guardrail dimension 3: Elasticity of bids vs clicks
If the concept of elasticity is new to you, I’d recommend reading my article “How to calculate elasticity of bids in PPC marketing”. Elasticity of bids tries to calculate how much of a percentage increase in clicks would we get for a 1% increase in your bid. Long story short, the idea is to understand which bid ranges we should never miss because a 1% increase in bids yields a much bigger percentage increase in clicks.
In the mentioned article, I covered one method of calculating elasticity using the cumulative sum of clicks. It is not the most common mathematical approach to calculating elasticity (for example, in my article I mention a simple liner fit, but a log-log regression or a constrained ML model can also be used). Given that I haven’t written an article about these other ways of calculating elasticity, we will stick to the cumulative metric method.
The chart below shows this cumulative sum of clicks per opportunity distribution (grey bars), with the dark blue line representing elasticity.
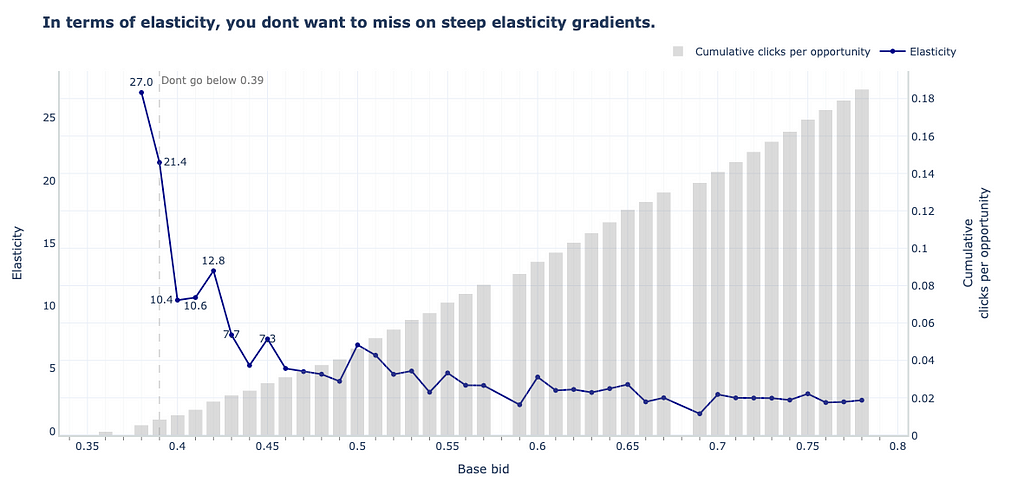
The plot above shows the following:
- Towards the left of the plot, the cumulative click per opportunity volume we are achieving is quite small.
- From there onwards, the higher the bid, the more clicks we will expect.
- However, the gains become smaller. For example, at the beginning, our elasticities range around 7% to 12%. This means that for a 1% bid increase in lower bids, we get 12% increases in the expected cumulative clicks. But, when we move towards the upper bid range, our elasticities plateau at around 2.5%.
Deciding the guardrails
With this information, we would establish a lower guardrail at 39p. Even though the volumes are small in that bid range, our expected percentage increases are significant, and therefore, we don’t want to go lower than that threshold.
Putting the 3 dimensions together in one single plot.
I will now show a series of plots where I iteratively show all the details we have discussed in one single plot. This way, we can decide the best guardrail considering the 3 dimensions together.

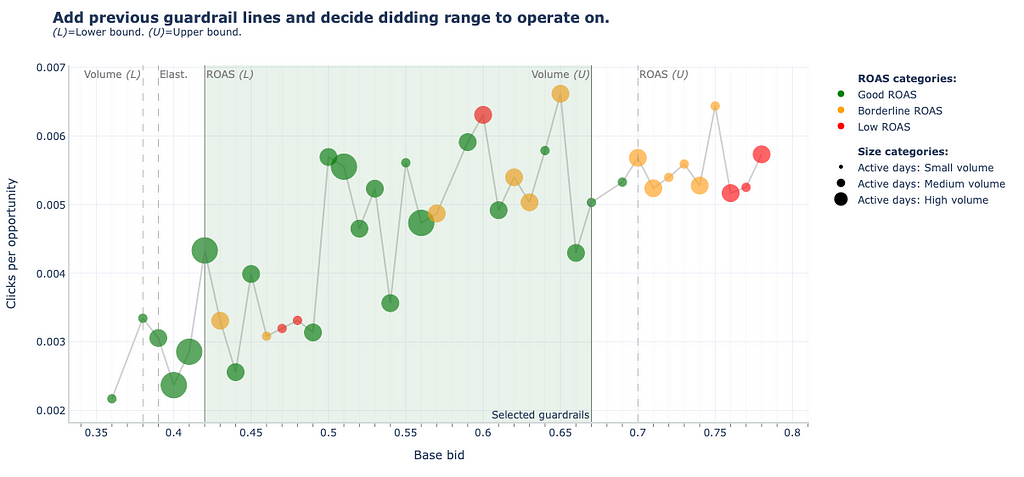
From the last plot, we decide that our guardrails should be set between 42p and 67p.
What if we had applied guardrails in our daily adjusted bids?
Everything you have seen is based on data from a life campaign. Funnily enough, I chose this example because it was a campaign where we DIDN’T have guardrails set. This way you can see the effects of our bidding algorithm without constraints, and simulate what would have happened had we implemented these guardrails.
The plot below consists of 2 charts:
- The top chart represents our daily bids.
- In light blue, you can see our real bids. They fluctuate adjusting automatically to target our ROAS goal.
- In dark blue, you can see what the bids would have been had they been capped by our guardrails.
- The dark blue dots show the specific dates where we would have hit these guardrails. - The bottom chart shows the 7 days rolling ROAS for each of these days.
- The green and red lines represent the ROAS goals we wanted to achieve.
- The black dots represent those days where bids hit the guardrails.
Take some time and see what do you interpret from these charts?

I will highlight 3 areas in the charts:
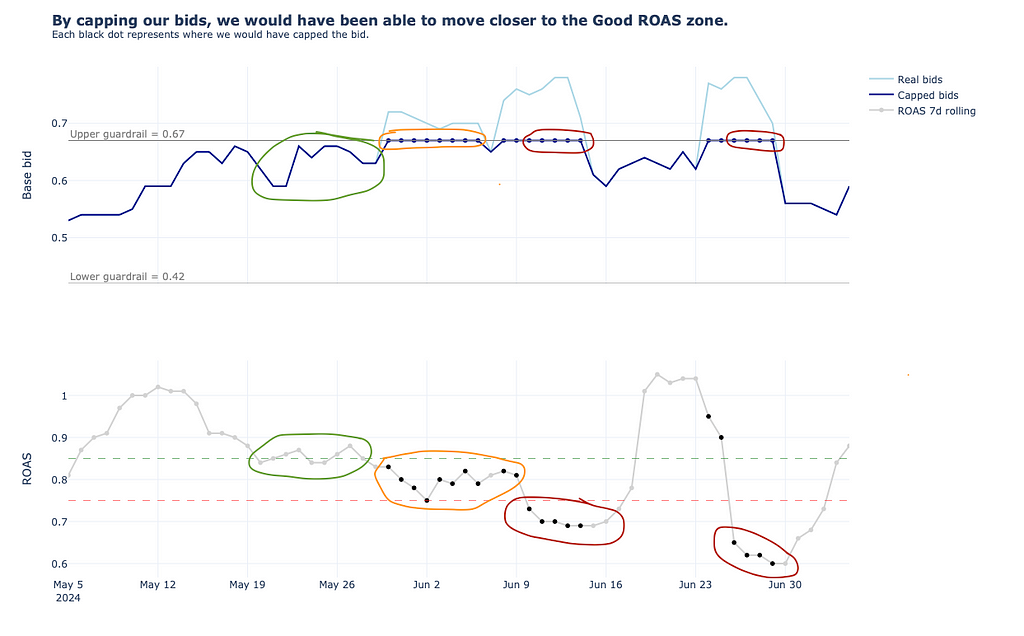
- Green area. This is where we want to be. See how the 7 day moving ROAS fluctuates between the “Good ROAS” zone and the “Borderline ROAS” zone. The bids are just slightly below the guardrails we would have set.
- Orange area. Look at the black dots around June 2nd. See how our ROAS has dropped consistently into the “Borderline ROAS” zone. We are bidding too much, and it is only the 7 day rolling ROAS with previous “Good ROAS” days that keep us in the borderline zone.
- Red area. We keep consistenly overbidding and our good ROAS days are not taken into account in our 7 day moving ROAS. This means that we fall well into the “Bad ROAS” zone.
Whilst I cant show you the results of our guardrails implementation, I think you can see how our set guardrails would have helped us mitigate this. By not overbidding, we would probably stayed closer to the “Good ROAS” zone. Of course our click volume wouldn’t be as high, but “Every euro counts” in marketing.
Automation of guardrail assignments
Until now, we have done a very manual analysis. If you are dealing with hundreds of campaigns, this is quite cumbersome to do on a regular basis. At Skyscanner, we always work with the premise of scalability. This is why we need automation. Here are a couple of ideas on how to set your guardrails programmatically at scale.
The first guardrails you set.
The lengthy exercise we have gone through can be used to set guardrails. In fact, my recommendation would be set do all of this manual analysis for your top performing campaigns (based on volume and cost).
For the longer tail campaigns, who could simplify the operation and go for 2 guardrails based on ROAS. For example:
- Extract the bids which landed in the “Good ROAS” zone (in the plot below, we have filtered out the data points where the ROAS was borderline or bad)
- Calculate the 25th and 75th percentile for the bids. In other words, pull the bids which would represent the 25th and 75th percentiles.

It is quite interesting to see that our simple selection is not too far off from our deeper exercise. As a comparison, the deep analysis established bid guardrails of (0.42, 0.67), whereas this simple one says (0.42, 0.58)
Updating your bid guardrails
Once guardrails are set, you shouldn’t just leave them untouched. Many factors in the market can change. For example, below you can see an extended view of the time series plot. Between January and June, we nearly doubled our bids to adapt to market conditions. If we don’t have a mechanism in place to adjust our guardrails, we can find ourselves like in the August period, where all of our bids are hitting the upper guardrail.

There are 4 scenarios to consider for upper guardrails
Focusing on the upper guardrail, there are 4 things that could happen:
- We are hitting upper guardrails and our ROAS is consistently bad. We should decrease our upper guardrail.
- We are hitting upper guardrails and our ROAS is consistently good. We should increase our upper guardrail.
- We are hitting upper guardrails and our ROAS fluctuates between good and borderline. This is where we want to be. Don’t touch the upper guardrail.
- We are not hitting upper guardrails, but our ROAS is consistently bad. The upper guardrail is too high, and we should lower it.
PS: you can reverse the logic for the lower guardrail scenario.
How could we define “ROAS is consistently good or bad”?
I suggest starting with something super simple
- A rolling count of days where we are hitting certain ROAS zone.
- A rolling count of days where we are hitting our guardrails.
Let’s cover the 4 scenarios above with these 2 simpe metrics.
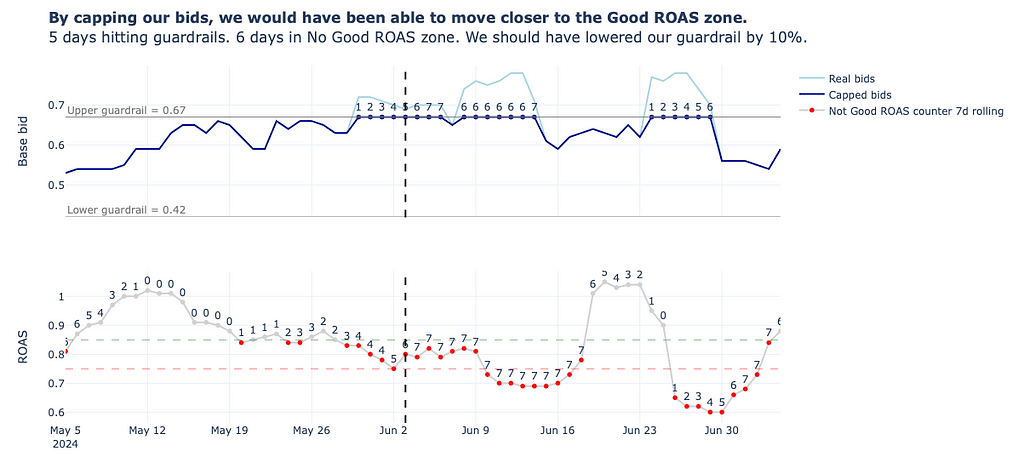
Scenario 1. We are hitting upper guardrails and our ROAS is consistently bad.
The chart below shows the timeseries we have been focusing on, but, with 2 additions: (1) the text on top of the capped bids representing the rolling 7 day counter of hitting the upper guardrail — for simplicity, I only showed where we did hit the guardrail. (2) the text on top of the ROAS trend representing the rolling day counter of hitting “Not Good ROAS zones”.
If both (1) and (2) are higher than 5, this means that we have been hitting 5 out of the past 7 days guardrails and not good ROAS zones. This is the moment where we should have lowered our guardrail (let’s say 10%) and restarted the counter.
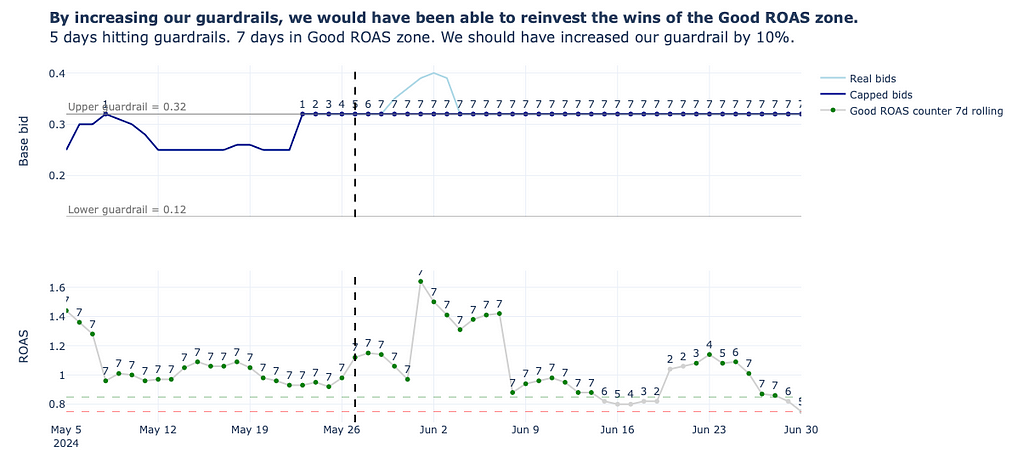
Scenario 2. We are hitting upper guardrails and our ROAS is consistently good.
Following the same logic above, but using a different campaign, this is what it would look like.
Scenario 4. We are not hitting upper guardrails, but our ROAS is consistently bad.

Summary
In conclusion, setting bid guardrails in PPC marketing is essential for maintaining control over your campaigns and ensuring efficient ad spend. By carefully analyzing ROAS, the frequency of tested bids, and bid elasticity, you can establish boundaries that protect against the volatility of bidding algorithms. This process can be manual and time consuming, but I have showed you some ideas to automate guardrail adjustments based on real-time data. Remember, every euro counts, and with the right guardrails in place, you can maximize your returns while minimizing risks.
Further reading
Thanks for reading the article! If you are interested in more of my written content, here is an article capturing all of my other blogs posts organised by themes: Data Science team and project management, Data storytelling, Marketing & bidding science and Machine Learning & modelling.
All my written articles in one place
Stay tuned!
If you want to get notified when I release new written content, feel free to follow me on Medium or subscribe to my Substack newsletter. In addition, I would be very happy to chat on Linkedin!
- Get notified with my latest written content about Data Science!
- Jose's Substack | Jose Parreño Garcia | Substack
How to Set Bid Guardrails in PPC Marketing was originally published in Towards Data Science on Medium, where people are continuing the conversation by highlighting and responding to this story.
from Datascience in Towards Data Science on Medium https://ift.tt/5MZNjXe
via IFTTT


