
Top 5 Geospatial Data APIs for Advanced Analysis
Explore Overpass, Geoapify, Distancematrix.ai, Amadeus, and Mapillary for Advanced Mapping and Location Data

Geographic data is important in many analyses, enabling us to decide based on location and spatial patterns. Examples of projects where geodata can come in handy include predicting house prices, route optimization in transportation, or establishing a marketing strategy for business.
However, as a data scientist, you will frequently face the challenge of where to obtain this data. In many cases, there are public sources with information on geographic data; however, in many cases, the information they provide needs to be revised for the analyses we want to perform.
This article will evaluate five of the most useful APIs for obtaining large-scale geographic data. We will assess their usage, advantages and disadvantages, and the main applications of the information they provide. Think of this article as a fundamental foundation for the use and applications of these APIs, so that you can later delve deeper into all the tools they offer.
1. Overpass
The Overpass API allows access to the information available on the OpenStreetMap website. OpenStreetMap is an open geographic database, containing a wide range of geospatial data, from information about underground routes to road, mountain, or river locations.
The data available in OpenStreetMaps is open and is maintained by users across the globe, therefore, the level of completeness depends heavily on the region, since there are areas where we can find more active users and therefore the platform has more data. However, the degree of completeness is in most cases high, allowing us to gather a lot of information for our geographic analyses.
The Overpass API uses a language called Overpass QL for designing the queries for accessing the data available on OpenStreetMap. This highly customizable language allows us to create specific queries to access only the information of interest for our analysis from the platform.
Advantages
- Completely free: because OpenStreetMap is an open database, the use of the API is also completely free.
- Flexible queries: queries can be highly customized using the Overpass QL language to access only the information of interest. Other aspects, such as the data output format, can also be customized in the query. Also, through the query, you can easily filter the geographic data you want to obtain, as well as the search area for such data.
- Global data: OpenStreetMap contains global data, as a consequence, the information accessible through the API is not limited to specific regions.
Disadvantages
- Quality of the returned API data: the OpenStreetMap platform, as mentioned before, is an open website maintained by volunteers. Therefore, the data quality depends on the users, which as a result can lead to incomplete data in certain regions where user activity is low.
- Necessary Learning for Query Construction: queries in the Overpass API are made using a language called Overpass QL, whose learning process can be particularly slow at first when one is not familiar with the language.
- Post-processing requirement: the data returned by the API, whether in CSV or JSON format, contains the coordinates of the geographic elements but does not provide processed polygons or multi-polygons we can use directly in our analysis. Therefore, we will need to convert the raw data to obtain the different polygons.++
License
OSM data is free to use for any purpose, including commercial use, and use is governed by our distribution license, the ODbL
Use Case — Retrieving Bus Stops in Cuxhaven
The following example shows how we can obtain all bus stops located in Cuxhaven using the Overpass API. Cuxhaven is a small town located in the northern part of Germany, on the shore of the North Sea.
The following code displays the query and the endpoint used to access the information via the API. The query specifies the search area (Cuxhaven), the type of element being searched (bus_stop), and the output format (json).
The get_overpass_data function is a generic function that can be used with any query to get a response from the Overpass API.
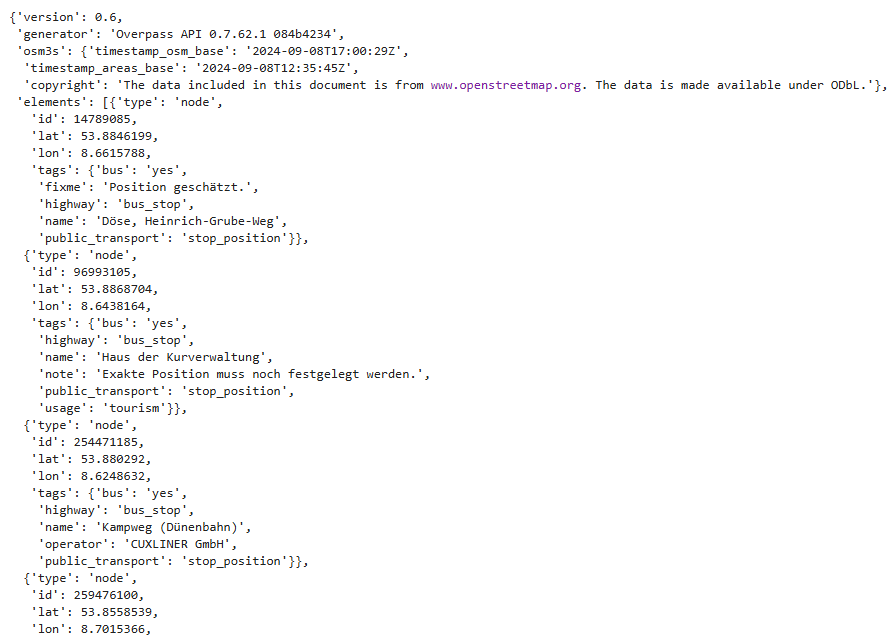
The bus stops are found in the key elements of the API response. The latitude and longitude of the bus stops are specified along with their names. Next, we proceed to visualize the results with Folium, but logically this information can also be used for many other analyses, such as studying how proximity to a bus station affects housing prices in Cuxhaven.
Insightful Articles
If you want to learn more about the potential of the Overpass API for obtaining information from OpenStreetMap, read the following articles. The first article shows how to obtain administrative regions of a city (neighborhoods) from the API. As seen in the article, post processing of data to obtain polygons is necessary, as the API does not provide them directly.
Obtaining Geospatial Polygons for Administrative Areas of Munich via the Overpass API
The second article shows how to obtain subway routes in a city. This use case is more complex than the one shown earlier, as it not only involves defining the locations of the subway stations, but also how the stations are connected to form the various routes.
Subway Route Data Extraction with Overpass API: A Step-by-Step Guide
As you can see, with the Overpass API the range of data that can be retrieved is huge: everything available in OpenStreetMap can be retrieved with the proper query.
2. Distancematrix.ai
I recently discovered this API, and it is especially useful for geographic analyses where distance and time, taking into account the road network, play a role.
Distancematrix.ai | Compute the distance and travel time between points
The distancematix.ai API primarily offers two services: (1) calculations of the distance and travel time between points on a map, and (2) geocoding services. Therefore, its APIs are divided into the following groups:
- The Distance Matrix APIs: this set of APIs allows calculating the duration of routes in terms of distance and time, taking into account traffic conditions. Distances can be obtained for various modes of transportation, including car, public transport, or walking.
- The Geocoding APIs: this set of APIs allows for geocoding and reverse geocoding, meaning translating addresses into geographic coordinates (latitude and longitude) and vice versa.
Advantages
- Availability of a free tier: although the API is not completely free, it offers a free plan with 1,000 monthly elements for the 4 available APIs. An element is considered the retrieval of a distance between a point of origin and a destination.
- Scalability: the API allows for making calls with multiple origins and destinations simultaneously to obtain distances in a matrix format. This contributes to the execution of large-scale projects.
- Modes of travel: the API allows you to obtain distances and times for 4 modes of transportation: driving, walking, bicycling, and transit (public transport).
Disadvantages
- Direct competitors: the Google Distance Matrix API is a much more established direct competitor with data obtained from the Google platform.
License
On their support page, there is a list of industries that could benefit from the use of the API. Commercial use is allowed; however, no specific license is mentioned.
Support page Distancematrix.ai
Use Case — The Distance from the Hotels in Barcelona to the Airport
In the case of wanting to make a proximity analysis, one straight line distance gives an approximation but not the exact measure of how much time it will take to travel between two locations.
To obtain this, it is necessary to consider the road network or public transportation. This information is precisely what we can obtain with one of the endpoints available in the distancematrix.ai API.
The following analysis we are going to conduct involves evaluating the distance from all the hotels in Barcelona to El Prat Airport, located south of Barcelona and very close to the city. We want to assess how much time we need on public transportation to travel from each hotel to the airport. We are traveling in the morning and do not want to spend too much time getting to the airport from the hotel.
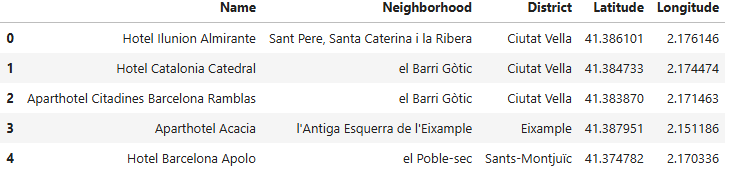
Firstly, we need to obtain a list of all the hotels in the city. This information is available in the city open data portal which includes a dataset with information about hotels located in Barcelona, including their location. You can download the dataset we will use in the analysis from the following link.
Hotels in the city of Barcelona - Open Data Barcelona
The file is read, selecting only the relevant information for the analysis.
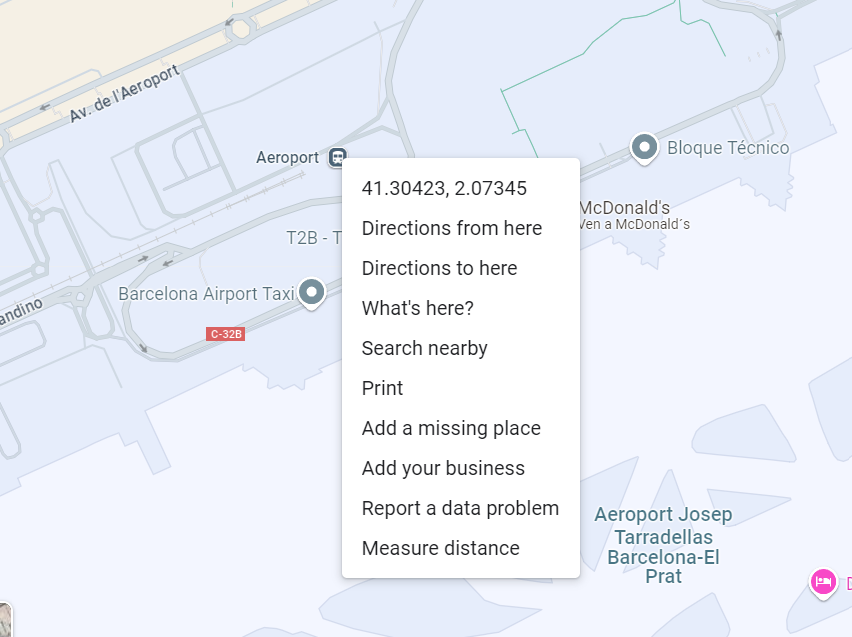
The location of the airport will be retrieved from Google Maps. This could be easily performed by going to a place of interest and right-clicking; after that, we view the latitude and longitude of the airport.
We now have the necessary information to build the pipeline. Below, the most relevant aspects of the pipeline, which is quite simple, are explained:
- For each hotel in the DataFrame, we execute an API call, providing the origin and destination coordinates.
- The selected transportation mode is transit. This mode of transport refers to public transportation.
- We scheduled the departure time for 8 in the morning.
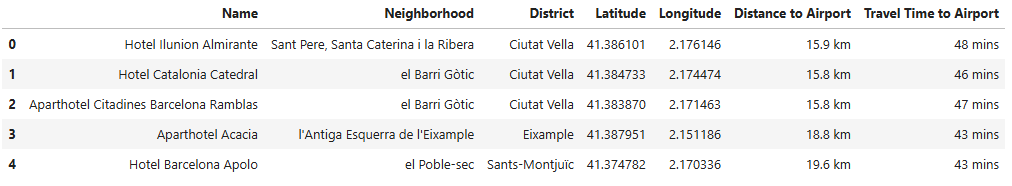
- The travel distances and durations to the airport are stored in a DataFrame, along with the hotel names. Finally, this information is merged into the original DataFrame.
I would suggest looking at the API documentation. There it says, for example, that we can query multiple origin and destination combinations at a time by specifying any number of destinations and/or origins with the ‘or’ operator. However, in our pipeline, we configured only one destination and one origin per API call.
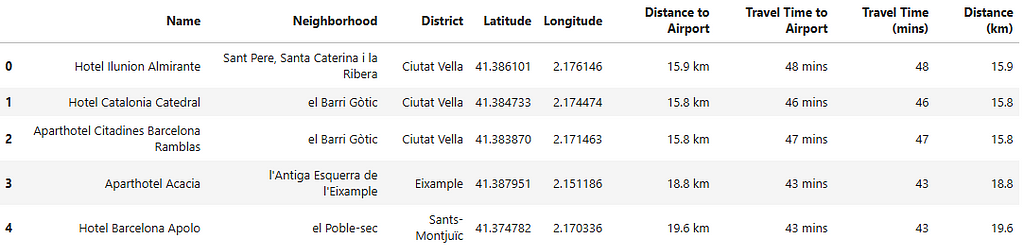
After obtaining the distances and travel times between the hotels and the airport, we will transform these columns to int by removing the indicators ‘km’ and ‘mins’. Then, we will have the dataset ready for visualizing the results.
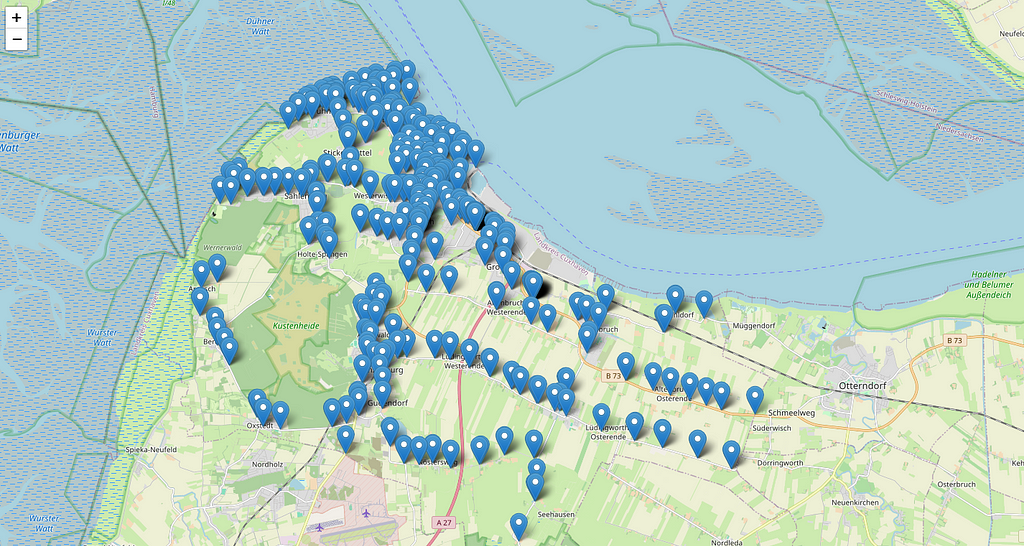
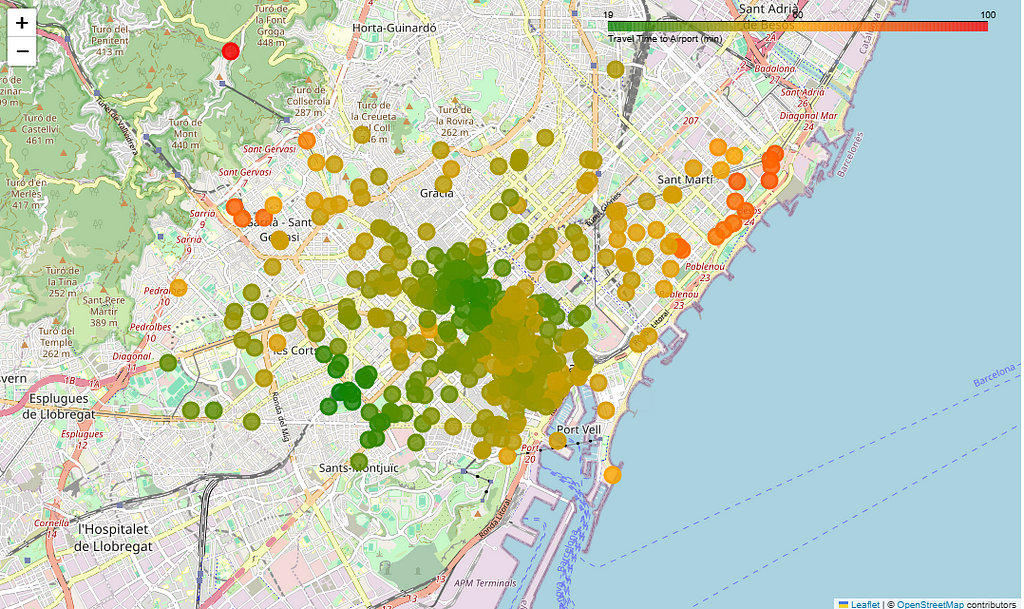
The following map shows the obtained results. As observed, two city areas are particularly well connected to the airport by public transportation. These areas correspond to the Sants station and its surroundings, as well as the Passeig de Gràcia area. As can be observed, there is an area that is particularly poorly connected to the airport, which corresponds to the northern part of the city near the beach.
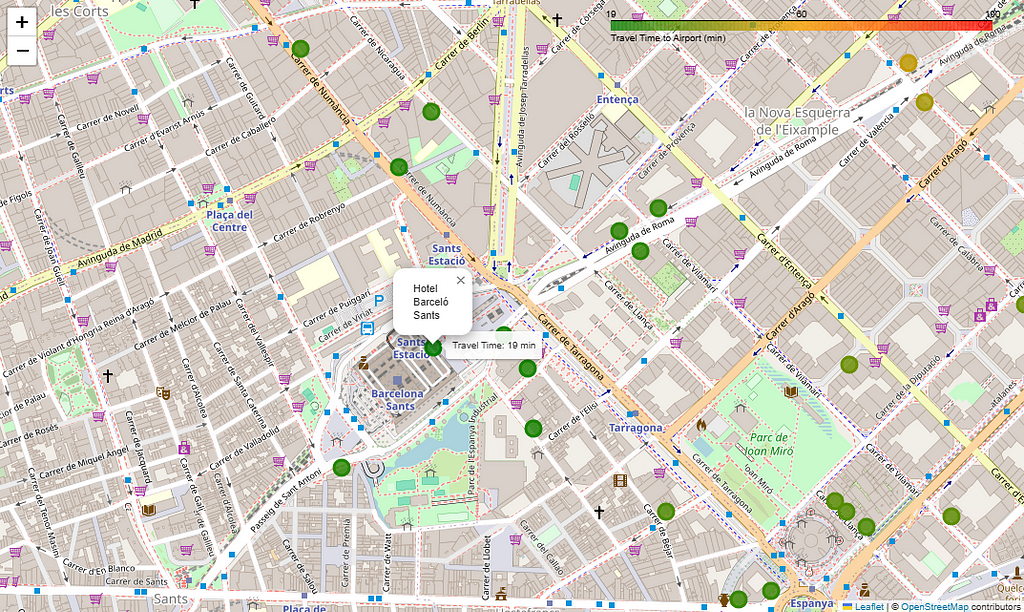
As seen in the image below, it only takes 19 minutes to get to the airport from the Hotel Barcelo Sants.
This is an elementary example of how we can use such valuable information as the time needed between an origin and a destination. However, the potential of this information is much greater and can be used in a wide range of studies, from the logistics sector to package delivery analysis. On the distancematrix.ai website, we can read about more detailed use cases.
3. Geoapify
Geoapify is a platform that offers a set of APIs for a wide range of geospatial services.
Geoapify Location Platform: Maps, Geocoding, Routing, and APIs
Its available services and APIs are divided into five main services:
- Maps: this service contains APIs for obtaining high-resolution images of maps, which can be used for geospatial analysis reports or marketing presentations. The maps are highly customizable, allowing the addition of markers and geometries to highlight specific areas.
- Address & Location: this service contains APIs for geocoding and reverse geocoding, allowing the conversion of addresses to latitude/longitude and vice versa. Additionally, Geoapify provides a service for address auto-completion, which returns a standardized address from a free-form address input.
- Routes: this service provides exact travel time and distance between locations for multiple transportation modes. In addition, the API response includes the route geometry as MultiLineString and details such as the speed limit for each section.
- Places: this API provides points of interest for more than 500 categories such as restaurants, tourist attractions, and supermarkets. The POI search can be conducted using a bounding box, radius, city, or isoline. The source for the POIs is OpenStreetMap, meaning we rely on the quality this platform provides, which is usually for some POIs lower than Google Maps. Additionally, as we have seen before, the same information can be obtained with the Overpass API, which is completely free.
- Reachability & Analysis: this service enables the analysis of the reachability of locations using isochrones and isodistances for multiple traveling modes.
As we can observe, many of the services that Geoapify offers are available on other platforms or APIs. This should not surprise us, as nowadays many companies offer similar services.
Advantages
- Extensive suite of APIs: the range of geospatial services offered by this platform is extensive, in contrast to other platforms that only specialize in a specific service.
- Availability of a free tier: although the API is not completely free, it offers a fairly generous plan with 3,000 credits per day. Paid accounts are also quite economical compared to other APIs; the most expensive one provides 100,000 credits per day for 249 euros.
Disadvantages
- Limited coverage: some services rely on information available from OpenStreetMap. However, as we mentioned earlier, this information is not always complete, depending on the geographic region.
- Alternative tools: as mentioned earlier, multiple companies are offering similar geospatial services and analyses. Therefore, it is possible to find platforms that specialize exclusively in one of the services provided by Geoapify.
License
Geoapify Free plan can be used in commercial projects. However, you must provide an appropriate Geoapify attribution or link to the website. The correct attribution is Powered by <a href="https://ift.tt/f2E6n78>
Pricing | Geoapify Location Platform
Use Case — Walking Distance Accessibility Analysis
As already stated, Geoapify offers a great variety of services. In this example, the Isochrone API available in the Reachability & Analysis section, will be used. This specific service returns a polygon including an area reachable by a certain transportation mode within a specified travel time from the location of choice. Here, we will calculate distances on foot; however, besides walking distances, the API also calculates isochrones for other means of transportation modes like driving, cycling, or transit.
The get_isochrone function performs an API call to get the isochrones around one location of Moratalaz’s neighborhood from Madrid, but you can put any location you want for your study or test. The desired walking distance was set as 10 minutes; the time is provided in seconds, since the API ranges are given in this unit.
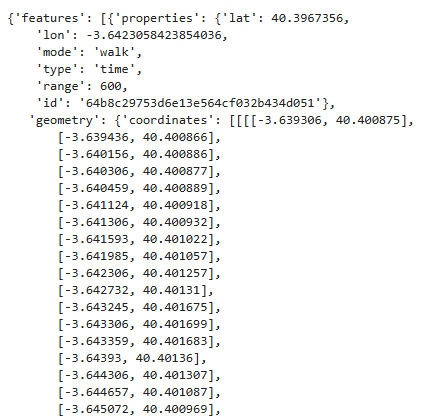
As shown above, the API response does not provide a MultiPolygon, but a list of its coordinates. Therefore, for further analysis using this data, we will often need to convert it into a Polygon.
The following code shows how to convert the API response into a MultiPolygon which we can easily visualize using folium.
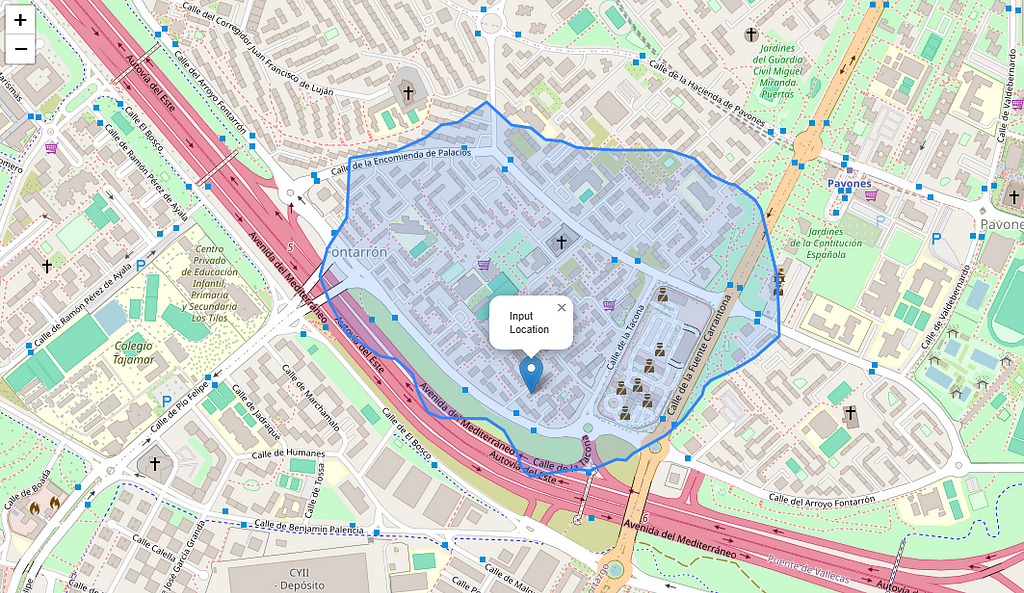
However, you’re probably wondering what type of analysis these isodistance polygons are useful for. Here, we’ve limited ourselves to visualizing them, but this type of analysis could be useful for evaluating, for example, the services available around a home, such as restaurants, supermarkets, and stores. This could influence housing prices. Another possible analysis could be to evaluate the area of the city that can be reached by public transport in less than 30 minutes. These temporal analyses are far more accurate than simple distance radii.
4. Amadeus
The Amadeus API is not specifically an API devoted to general geospatial data, but rather to the data corresponding to the tourism sector. However, many of the services they offer can be considered as geographic data of interest to various analyses.
Next, we will mention the main services they offer related to geospatial data:
- Hotels APIs: this API provides the location of more than 150.000 hotels worldwide. You can search for hotels inside a city or an area. You can use the HotelID provided in the output response in the Hotel Search API to obtain details about the hotel room prices and services.
- Points of Interest APIs: the API makes available information on points of interest regarding the tourism sector.
If you are interested in the tourism sector, it might be of interest for you to enter and find out what Amadeus is offering at the following link.
Connect to Amadeus travel APIs | Amadeus for Developers
Advantages
- Sector-specific API: Amadeus API is one of the most powerful APIs for retrieving tourism-related data outperforming other popular and generic APIs such as Google Maps or OpenStreetMap.
Disadvantages
- Complicated documentation: the documentation offered is more complex compared to other API documentation. It takes quite a bit of time to become familiar with it before starting to use the API and building the pipeline for data extraction.
License
On their support page, there is a list of industries that could benefit from the use of the API. Commercial use is allowed; however, no specific license is mentioned.
Connect to Amadeus travel APIs | Amadeus for Developers
Use Case — Obtaining Hotels in Ingolstadt
The proposed example uses the Hotel List APIto retrieve a list of hotels located in Ingolstadt. We will search hotels using the geocode of the city rather than by city name. The API provides multiple filtering options such as amenities available in the hotel, hotel starts, hotel chain, or radius from the specified input location. In this case, we will only use the proximity filter for our search.
First, we need to log in to the platform and go to the My Self-Service Workspace section. There, in My Apps section, we can create our app. Once the app is created, Amadeus will provide us with two keys, an API key and an API Secret.
Amadeus for Developers uses OAuth to authenticate access requests. OAuth generates an access token which grants the client permission to access a protected resource. Once you have created an app and received your API Key and API Secret, you can generate an access token by sending a POST request to the authorization server:
https://test.api.amadeus.com/v1/security/oauth2/token
The get_access function demonstrates how to get the access token using the OAuth authentication method.
The OAuth authentication method provides higher security as tokens are temporary and expire after a certain period, in contrast to API keys, which remain always the same. This authentication method contrasts with the methods used by the other APIs mentioned in the article, in which all, except for the Overpass API that does not require authentication, perform authentication simply by using an API Key.
Once the App is authenticated, we need to obtain the Ingolstadt coordinates (latitude and longitude) from Google Maps. Additionally, we have evaluated different distance radii on the map to select the appropriate one. To measure a distance in Google Maps you have to right-click on the map and select Measure Distance. Then, click on the destination to obtain the measurement. After evaluating different distances, we have selected a radius of 5 for the hotel retrieval.
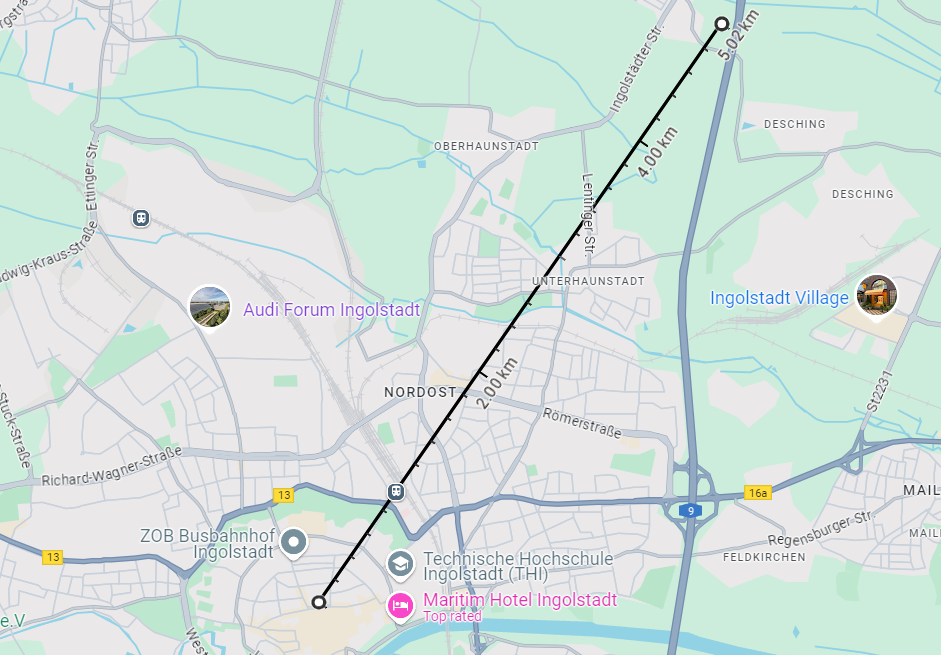
Finally, we perform the API call to the Hotel List API endpoint, obtaining a list of hotels located within a 5-kilometer radius of Ingolstadt city center.
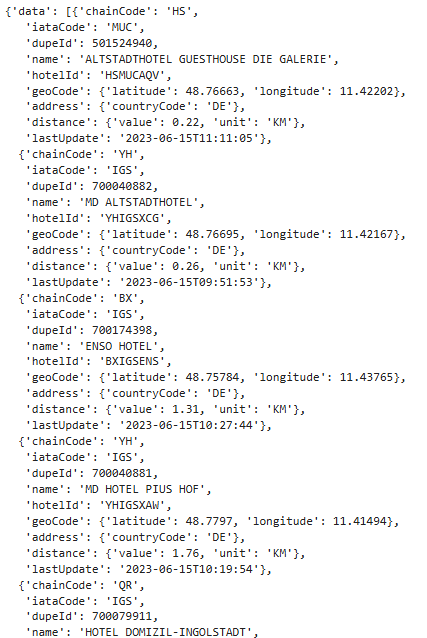
For the Hotel List API, we have a total of 2000 requests per month, free with the trial version.
One aspect I would like to point out is that the Amadeus API did not provide all the available hotels in Ingolstadt for the evaluated radius. Some hotels are not present in the response. The positive aspect is that for the hotels provided, price tracking can be done easily, information that can be useful for more advanced analysis.
5. Mapillary
The Mapillary API allows to access all images available on the Mapillary platform. This platform is an open database of street images provided by volunteers across the globe. The Mapillary API is especially useful for projects where a large number of street images need to be analyzed without manually collecting the images. These projects could include urban planning, traffic condition analysis, or traffic sign recognition.
Advantages
- Notable number of images: this is a free database that contains an extensive number of images, all of them with their corresponding metadata. This database is continuously being developed and updated.
Disadvantages
- Complicated documentation: the documentation offered is more complex compared to other API documentation. It takes quite a bit of time to become familiar with it before starting to use the API and building the pipeline for data extraction.
- Limited Coverage: the images available on the platform depend on user contributions, which is why there are regions with extensive coverage and others where it is minimal.
License
When you upload imagery to Mapillary, you give Mapillary the rights to use the images for commercial purposes. However, you still own the full rights to the images you contributed, and you always will.
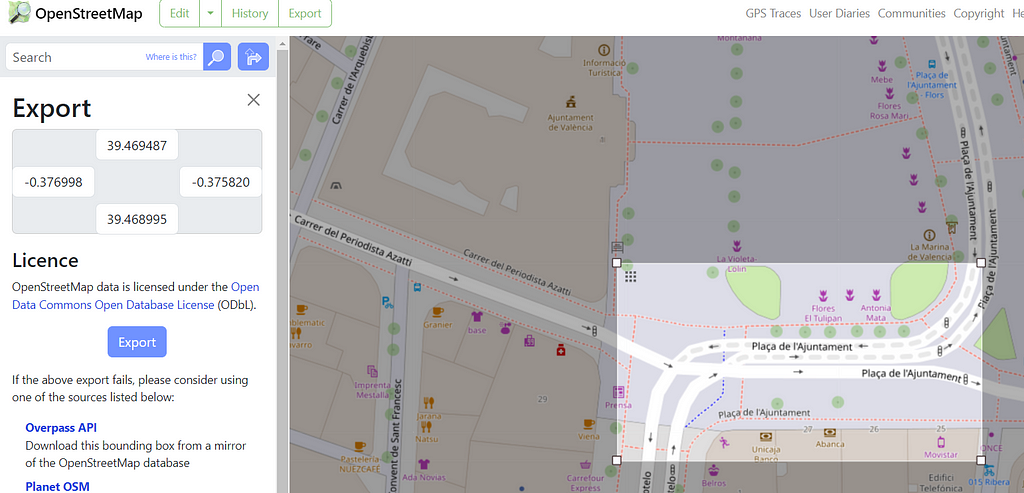
Use Case — Images of Valencia City Center
We use the Mapillary API to obtain images of the Valencia city center. Before actually retrieving images, we must define a bounding box that will determine the search area for images.
A bounding box is defined by two sets of coordinates, the bottom-left and the top-right corners. OpenStreetMap has in the section Export a possibility to export manually selected bounded boxes.
This bounding box is used to select the tiles that define the image search area. The Mapillary API does not define the search area using bounding boxes but rather uses a zoom-level {z}, an x-tile coordinate {x}, and a y-tile coordinate {y}.
We will not go into detail about how to obtain both the x-tile and y-tile from a latitude, longitude, and zoom level, but if you are interested in understanding how the calculations are done, I invite you to read the following article.
How to calculate number of tiles in a bounding box for OpenStreetMaps
We will perform the transformation using the mercantile library. This library provides a function to fetch all the available tiles inside a bounding box. We will make an API call for each available tile in the bounding box to get the available images. The API response is in vector tile format; we will convert it to GeoJSON format using the vt_bytes_to_geojson function.
The function get_tiles_in_bbox provides as output a list of GeoJSON elements each of them containing information on the images available in the tiles within the bounding box.
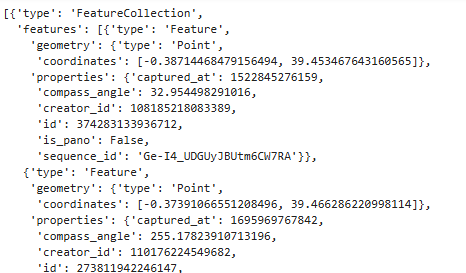
For each image, the following information is provided:
- captured_at (int): timestamp in ms since epoch
- compass_angle (int): the compass angle of the image
- creator_id (int): unique user ID of the image owner (not username)
- id (int): ID of the image
- sequence_id (string): ID of the sequence this image belongs to
- organization_id (int): ID of the organization this image belongs to. It can be absent
- is_pano (bool): if it is a panoramic image
Now we have all the image IDs and can proceed with their download. Below is shown how to download an image and visualize it in the Jupyter Notebook. However, a pipeline could be created to download all available pictures. Additionally, using the sequence_id, the images corresponding to the same sequence could be grouped into a single folder.

It is important to note that many of the images provided in response to the last API call are outside the bounding box we previously defined. This is because the tile is much larger in dimension than the bounding box. Therefore, if we only want to retrieve the images located within the bounding box, we should use the image coordinates and check if they are within the bounding box to filter them accordingly.
APIs allow for the large-scale acquisition of relevant information. In many projects, geographic data plays a crucial role, so being able to obtain it with the tools available on the market is something essential that we, as data scientists, need to be capable of. First things first: understand what’s at our disposal and what that can offer. In this post, we evaluated 5 APIs that allow obtaining geographic data, but there are many more that are not included in this top 5. I invite you to do some further research and try the tools mentioned in this post; you will find they are really useful.
Thank you very much for reading,
Amanda Iglesias
Top 5 Geospatial Data APIs for Advanced Analysis was originally published in Towards Data Science on Medium, where people are continuing the conversation by highlighting and responding to this story.
from Datascience in Towards Data Science on Medium https://ift.tt/1hjy4oL
via IFTTT


