Learnings from My First Year of Being a Data Analyst
Insights on dealing with statistics, interacting with people, and maximizing productivity at the workplace
If you are not a Medium Member, click 👉🏽 here 👈🏽 to read this article for free.
In August last year, I joined Google as a Data Analytics Apprentice. It was the start of my working career. Crossing the year mark made me ruminate about what I had learned in different dimensions of my job and work-life during this time. I don’t think there’s ever been a period where I have undergone a more rapid metamorphosis. It’s been a challenge but a fun one!

I have divided my learning into three categories: data science, productivity, and people.
Data Science
- In real-world data science problems, high accuracy will be obtained simply because the dataset is extremely skewed and not because the algorithm performs well. You can have a dataset with a negative-to-positive class ratio of 1000:1 (like for spam classification), and this imbalance will lead to a high accuracy greater than 99% if we classify all points as negative. Hence, it matters to choose the right metric for evaluation, which is recall in this case. A high recall score would indicate that the positive classes are being “recollected” correctly.
- While using a statistical test, one must ensure that the data follows the assumptions made for the test. I remember using the Chi-Square test for a particular project, and my manager questioned me about it. I told him all the mathematics I knew about Chi-Square, but it was only later that I understood he was trying to make me assess whether the test’s assumptions were met, so that using the Chi-Square test actually made sense!
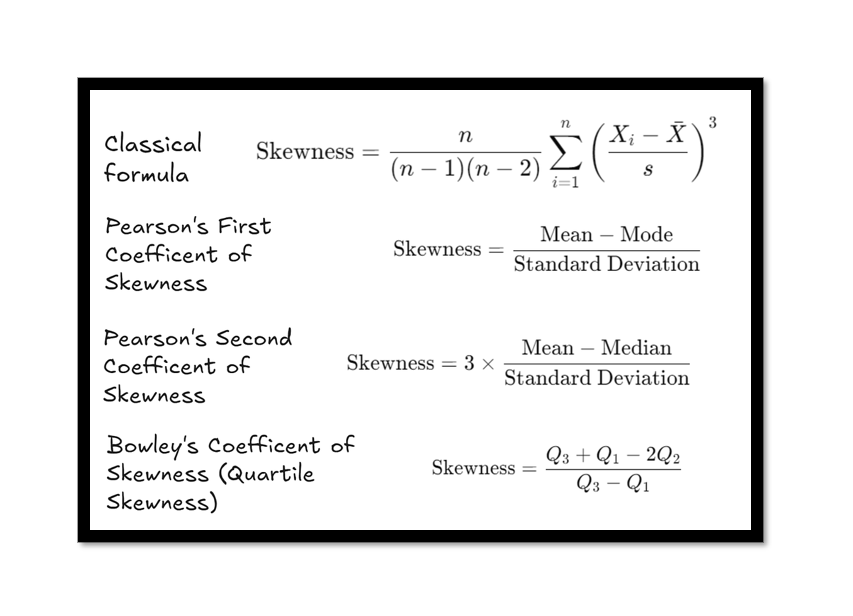
- There could be multiple ways to calculate the same metric. For example, the skewness of a distribution can be calculated using the classical formula. However, there are other ways to calculate it, such as Bowley’s coefficient or Pearson’s coefficient. Choosing the right metrics and selecting the right approach to calculate them for a particular problem is a skill you learn with experience.

- Views, clicks, and engagement earn you money on the internet. So, there will always be bad actors trying to boost these metrics artificially to generate more revenue. A way to deal with traffic from automated entities or bots is to analyze their behavioural patterns, which will differ significantly from those of humans. For example, a human might log in to a social media app at a certain time — after waking up or before going to bed. However, a bot might get activated at a specific time and crawl an app longer to boost traffic.
- The real challenge of creating a dashboard is making information digestible at a glance. Creating my first dashboard taught me that this activity wasn’t about simply dropping tables and laying out graphs; it was about organizing and displaying them in a manner that stakeholders could benefit from, especially given their busy schedules. Though the work initially felt like mere physical exertion with the constant clicks and drags of my mouse, I soon discovered mental stimulation in the design aspect — finding the right kind of graphs and layouts to organize information efficiently.
- Every data science problem is ultimately a mathematical problem. You have to tackle it from its first principles. If you can’t explain the solution, you don’t really know the solution. In a world of inbuilt libraries and packages for programming languages, it is easy to train a machine-learning model and get good scores on the output metrics. However, being able to actually tell the stakeholders what is happening is another thing. When that involves deep learning models, it becomes even more challenging.
- Data Science requires patience and curiosity. It took me two books and numerous articles to understand the p-value. The effort was worth it because I now intuitively understand the concept: “A high p-value means that, assuming the null hypothesis (no effect or difference) is true, there is a high probability of observing the results seen in the data (or something even less extreme). When this probability is high, it suggests that any difference observed is likely due to chance or random variation. Therefore, we “fail to reject” the null hypothesis because the data does not provide strong evidence of a true effect or difference beyond random variation.”
- It is possible that while trying to solve something, you realize there is no technological capability to solve this problem right now. But technology evolves, and that too rapidly. What matters is you write why things didn’t work out so that when you or someone else works on the same problem a few years later equipped with better technology, they can eventually carry on your progress rather than starting again from nothing.
- For graphical visualizations in Python, Plotly is much simpler and produces better visuals than Matplotlib. Its interactivity feature is a plus.
Productivity
- Writing meeting notes and a daily journal keeps you on track with how your work life is going. It also acts as an accountability mirror — if you are skipping it, perhaps you are skipping doing your work, too.
- I don’t see a difference between project documentation and story telling. A project documentation is basically a story you tell to your stakeholder about your project. Here, the main character is the metrics, the villain is the blockers, and the story is about the different approaches you took to tackle the problem. Only when I started writing project documentation on the job, did I realize the importance of all those story-writing and essay-writing competitions I had participated in in my school days.
- If you are stuck with a code's logic, take a break instead of being glued to the desk. Whenever I feel mentally exhausted, I go for a walk in the office garden. Either the walk energizes me, gives me ideas, or both.
- Any job involves athleticism. Physical sports require physical athleticism, and mental jobs require mental athleticism. Going to the gym and having a proper diet matter. Thanks to my gym trainers, I bulked up from 58kg to 65kg after joining Google, and I feel much fitter and robust now.
- Data Science is best learned on a whiteboard. If your office has one, make the most of it.
People
- One of the perks of working in Google India is the shared commute to the office. It’s a great transportation perk and a great way to network with colleagues. Nothing beats the Bangalore traffic more than an interesting conversation!
- If you don’t ask for help, you won’t receive it. Ideally, anybody should want to help because helping others is, in fact, a selfish act. It provides a direct path to pleasure by triggering the release of serotonin and oxytocin, the hormones responsible for making us feel good.
- Everyone has interesting stories and perspectives. So talk with them. Once I asked the barista in the Cafeteria (who knows my coffee preference by heart) if he gets tired of making coffee from 9 am to 6 pm for a few hundred employees. He said he doesn't get tired of making coffee, but he gets tired of standing all day. I asked him, “Does it get painful?” And he gave a clever reply. “Every job has some pain associated with it. Aren’t you here for a coffee because you are tired of staring at a computer screen all day?”
As my second year at Google begins, I am excited to gain more experience and meet new people. If you want to read a more philosophical article about my transition from a college boy to an office worker, check out this article I wrote a few months back 👇🏽. Ciao!
Learnings from My First Year of Being a Data Analyst was originally published in Towards Data Science on Medium, where people are continuing the conversation by highlighting and responding to this story.
from Datascience in Towards Data Science on Medium https://ift.tt/MtLuofq
via IFTTT


