Data behind the Luck, Ambition, and a Billion-Dollar Dream: Lottery
Data Behind the Luck, Ambition, and a Billion-Dollar Dream: The Lottery
Going through Seattle’s local retail store data for consumer patterns of the lottery (with SQL, Python)
If you are not a paid member on Medium, I make my stories available for free: Friends link
Today’s article takes a slight detour from my usual data-science-focused pieces, but don’t worry — it won’t deviate too much (hopefully it provides you with an interesting analysis and insights as well)!
Today, I’ll be talking about a topic that probably everyone has talked about at some point in their life — be it jokingly with friends or as a serious daydream. What is it, you ask?
The Lottery
As most of you may know… the lottery has been a symbol of luck and ambition for decades. How many times have you heard someone say, “This is my life-changing ticket,” or “If I win, I’m going to quit my job and travel the world”?
Even if gambling isn’t your thing — and for most people, it’s not — a lucky golden ticket and a life-changing jackpot have a way of drawing people in.
Now, I’ll admit, I’m not one to gamble. Spending hard-earned money on something with odds like 1 in 292 million? Not exactly my idea of a sound investment.
But even I can’t ignore getting interested, especially when the prize pool reaches astronomical figures. You gotta admit, it’s hard not to feel a little tempted to go to a local grocery store and buy yourself a ticket — even if you swore you’d never gamble.
Take the recent Mega Millions jackpot (December 2024), for example. It hit a jaw-dropping $1.3 billion, with the lucky winner coming out in California. Seeing such an enormous figure left me asking…
How does the prize pool get that big?
The obvious answer is simple: no one gets the winning ticket, and the prize rolls over to the next drawing.
But is there more to it? Could larger jackpots attract more ticket buyers, creating a feedback loop that inflates the prize pool even further? I would assume so, but how true is it?
My Curiosity Meets Data
Well… This is the kind of question I’ve always wondered about whenever I heard my friends or colleagues talk about how big the prize was for the lottery.
So, like the Curious George that I am (my name isn’t George, but you get the point), I decided to look at this “gamble” through the lens of data science. Lucky for me, I was fortunate enough to gain access to the lottery ticket sales data (2020–2025) from a family member who owns a retail store that sells a significant volume of tickets each year.
While I don’t have insight into the operations of the national lottery entities themselves, I do have access to something even more personal — a local snapshot of consumer behavior.
The next few sections are where I’m going to take a closer look. The lottery may be a game of chance, but there’s a wealth of insight hidden in the numbers.
A Quick Background
For those unfamiliar with the lottery system in the United States, there are two major nationwide games:
- Powerball
- Mega Millions
These games are responsible for some of the largest jackpots in history, with prize pools often rolling over into billions when no one wins the grand prize. Both games operate similarly: players pick numbers, and a draw determines the winner. But the odds? They’re astronomical. For Powerball, the odds of winning the jackpot are roughly 1 in 292 million, while for Mega Millions, they are 1 in 302 million.
Despite these odds, millions of people play every week.
Why?
I’ll borrow the words that I’ve seen on social media a fair bit ago. “Why? Because for a few dollars, people are not just buying a ticket — they’re buying a dream.”
The Data: What Can We Learn?
With data spanning from beginning of 2020 to the end of 2024, I set out to answer one simple question: Does the data tell us anything about what drives people to buy lottery tickets, and what could I infer from them?
Before we move on looking at the data, it’s important to address a significant challenge the business faced in 2024. Due to extensive construction in the area, the store was left without accessible roads for it’s customers for much of the year. This understandably led to lower average sales during that period, which will be reflected in the data.
Extracting Lottery Sales Data from the database (SQL)
Before I go into the analysis itself, I would like to show you briefly on what the data tables looked like. Why? Because extracting the lotto sales data from an old POS system’s database was no small task.
The terrible design and lack of organization made the process quite challenging. Data types were inconsistent, column names were terrible, and table structures were far from intuitive.
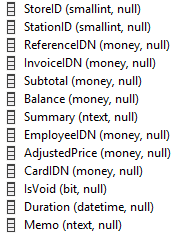
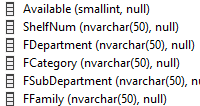
However, after an hour of analyzing the tables in the database, I learned that a table included a subtotal, date, ReferenceID to a category table, and the category table had labels for the products (of course there were more, but these were all I needed for now). It was nice because for lotto ticket sales, the category was defined as “Lottery,” so all I needed to do was some LEFT JOINs to extract the data! Here’s a simplified example of how it came together.
-- Note: Column names weren't actually this simple --
SELECT
 ti.itemID,
 ti.date,
 ti.subtotal,
 ti.summary, -- Description of the item
 ci.category
FROM ItemSalesTable ti
LEFT JOIN CategoryTable ci -- Join
    ON ti.ReferenceID = ci.CategoryID
WHERE ci.category = 'Lottery'
ORDER BY ModifyDate;
Sales Trends
After extracting and transforming the data in SQL, I ended up with a much cleaner dataset, ready for deeper analysis in Python.
All python code for graphs are at the end of the article!
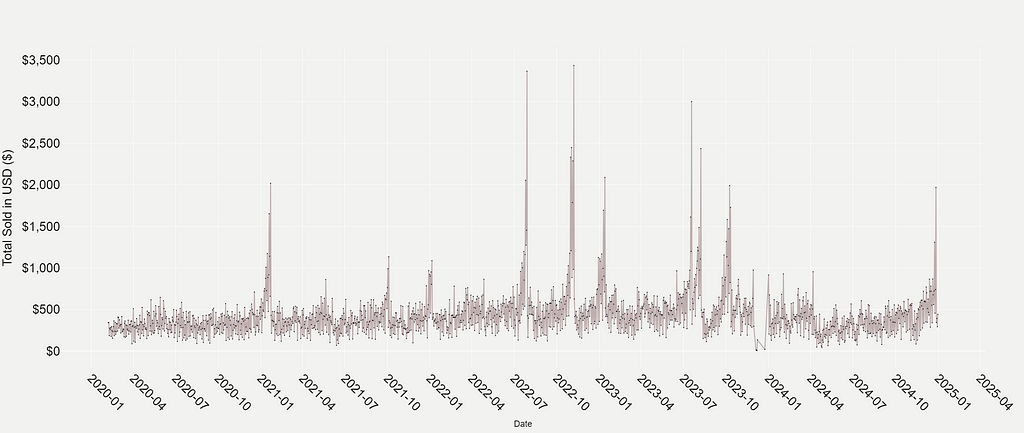
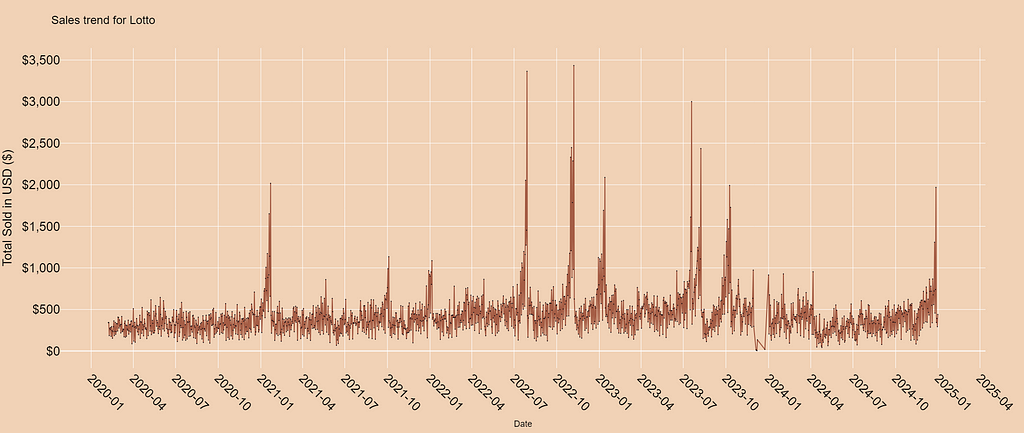
At first glance, the daily sales figures look pretty consistent. Some days have higher sales, some have low sales. However, you can’t help but notice the sharp spikes scattered across the timeline. These outliers immediately caught my attention, prompting the question: What causes these dramatic increases in sales?
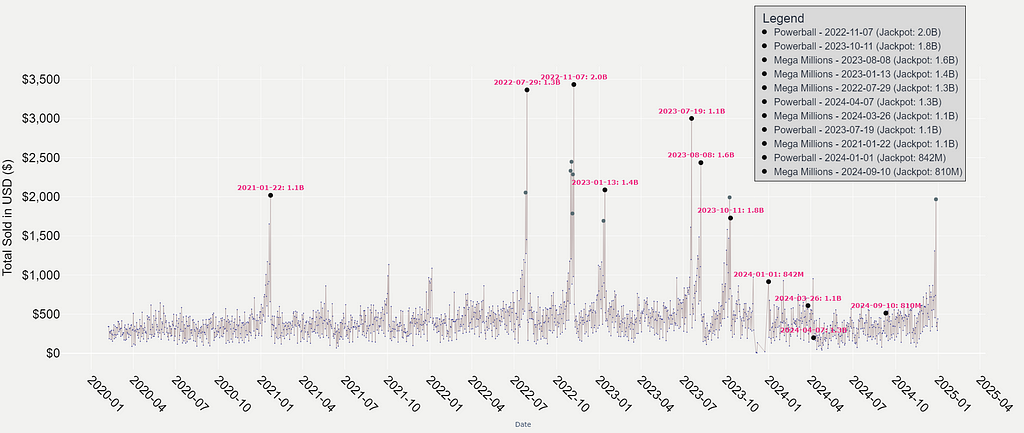
Honestly, as you may have guessed, the answer is pretty straightforward. It’s what the news media often refers to as “Jackpot Fever.” As jackpots grow larger, the allure of massive prize pools drives significant spikes in ticket sales, and this pattern is evident in the data.
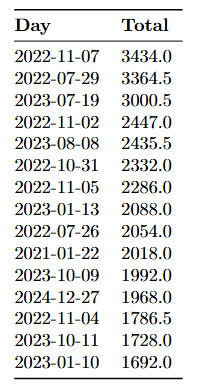
For example, during the November 2022 Powerball jackpot, which reached an unprecedented $2.04 billion, daily ticket sales from the retail store spiked by over 600% compared to the monthly average. Not only was this the highest spike in sales across the entire dataset, but it was also accompanied by sustained increases in the days leading up to the jackpot being claimed. These pre-draw spikes suggest that the rising jackpot had captured the attention of both regular buyers and those who don’t typically participate.
A similar trend emerged in October 2023, when the Powerball prize pool reached $1.76 billion. Once again, the excitement surrounding the jackpot drove significant sales surges. I think it really shows how larger prize pools influence consumer behavior!
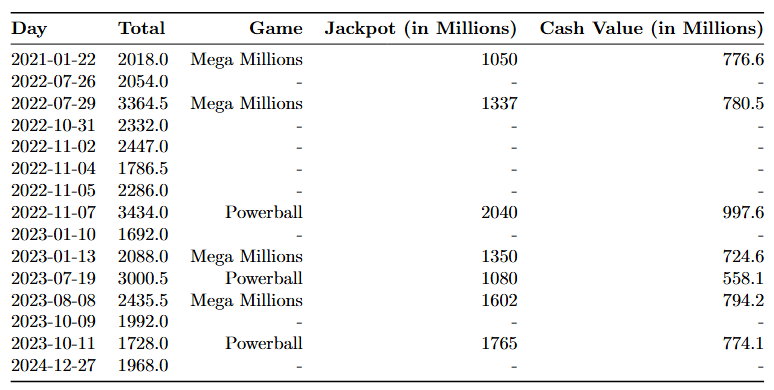
# Find the top 15 sales data from the 'subtotal' column
top_15_indices = data.nlargest(15, 'subtotal').index
data.loc[top_15_indices]
What’s particularly fascinating is how these insights come from just a single retail store’s data. It shows that these moments aren’t just about numbers —it represent a collective psychological dream amongst all Americans.
So, What Do You think the Spikes Reveal?
I think that the graph highlights much more than just jackpot-driven sales; it offers a pretty interesting insight into human behavior and cultural influences.
The Feedback Loop of Large Jackpots
As prize pools grow, sales naturally follow suit. Larger jackpots create a feedback loop, where the promise of incredible money (and retirement) drives higher participation. Obviously, as you may be able to imagine, inflates the jackpot further. I think it truly reflects the power of hype, media coverage, and the fear of missing out (FOMO).
Seasonal Influences
It’s also very interesting to see that the spikes in ticket sales align with certain times of the year, particularly holiday periods. Noticeable increases occur at the end or beginning of each year, likely driven holiday gifting and New Year optimism.
The owners of the retail store have told me that some people spend over $1,000 dollars sometimes on Lotto tickets for their family gifts! Crazy.
The Pandemic Effect
Interestingly, the spikes were less frequent in 2020 and 2021. This likely reflects the impact of the COVID-19 pandemic. In the early days of the pandemic, sales dipped as people prioritized essentials (remember the toilet paper shortages?). However, as the year went on, sales rebounded.
I think it’s fair to say that insights from this data does have some points that a data scientist or a data analyst could question to analyze further.
More Than Just Lotto
I know this article has been focused on the sales data. But, I personally think it’s very important to highlight that lotteries do more than just offer a chance at striking it rich. They play a critical role in supporting small businesses.
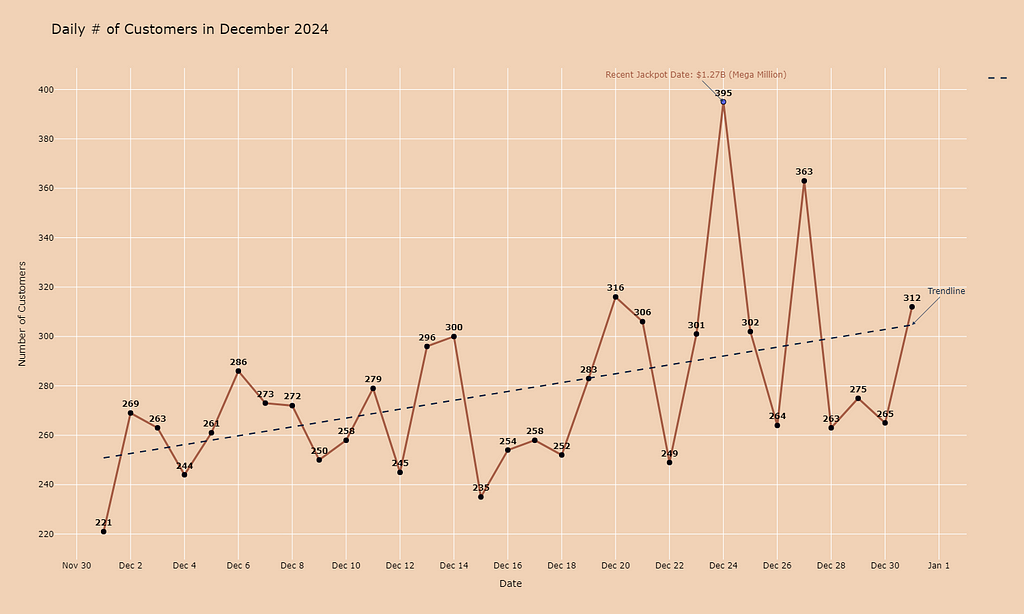
For many local stores selling lottery tickets isn’t just another transaction — it’s a means to bring in customers who might not otherwise walk through their doors. These visits often lead to additional purchases, whether it’s a cup of coffee, a quick snack, or a last-minute item. This boost in foot traffic is especially vital during challenging economic times or when stores are working to recover from setbacks.
Take, for instance, the retail store behind this data. After enduring months of disruptions caused by extensive road construction (concluded around August and September of 2024), the store struggled to regain its usual customer flow.
However, the recent surge in lottery jackpots has led to a dramatic rebound in foot traffic, with December marking the highest numbers of the year — returning to the levels the store saw before the construction began.
So, while the lottery is often seen as a gamble, I think it serves a much larger purpose. It acts like a small catalyst for the local economy, helping small businesses not just survive but thrive. Every ticket sold isn’t just a chance at a dream for the buyer — it’s also a lifeline for the businesses that rely on those customers to keep their doors open.
Wrapping It All Up
I think there’s a lot more to find and talk about using the data, but I wanted to keep this article shorter than my usual. I’ll provide the code snippets down near the end of my article for those that are interested.
The lottery, at first glance, might seem like just a gamble. But it’s interesting to see that there could be much more. From the sharp spikes during massive jackpots to the steady role it plays in sustaining small businesses, I think the lottery serves as a fascinating intersection of luck, ambition, and community impact.
For the store behind this data, the lottery wasn’t just about selling tickets. It was a way to rebuild after months of struggle, drawing customers back in and reigniting their business. For the buyers, every ticket represented more than just a chance at wealth — it was a moment of shared excitement, hope, and participation in something bigger.
At the end of the day, the lottery tells a story. It’s one of human optimism and resilience, of businesses finding ways to thrive, and of a community coming together over the slim but enticing possibility of changing their lives forever.
And maybe, just maybe, that’s what makes it worth all the hype.
Connect with me!
If you made it this far, I assume you are an avid reader of Medium. If you are a data scientist, someone who is in the field, or someone who wants to learn, I would love to have a chat with you! Please feel free to connect!
For those wondering about my images: Unless otherwise noted, all images are by the author (myself).
The owners of the data (retail store) have also authorized the use of them for the article purposes.
Code
I would like to point out that I did not include any actual data in the code.
1st Graph
# Create the figure
fig = go.Figure()

# Add the line for total price
fig.add_trace(go.Scatter(
    x=daily_lotto_data['day'],
    y=daily_lotto_data['Total'],
    mode='lines+markers',
    name='Price per Item',
    line=dict(color='#a65e46'),
    marker=dict(color="#02000d", size=2),
    hovertemplate='<b>Date:</b> %{x|%Y-%m-%d}<br><b>Total Sold:</b> $%{y:,.2f}<extra></extra>',
))

# Customize the layout
fig.update_layout(
    title=dict(
        text='Sales trend for Lotto',
        font=dict(size=24, family='Arial', color='black')
    height=900,
    xaxis=dict(
        title=dict(
            text='Date',
            font=dict(size=18, family='Arial', color='black')
        ),
        tickformat='%Y-%m',
        dtick='M3',  # Every 3 months
        tickangle=45,
        tickfont=dict(size=26, family='Arial', color='black')
    ),
    yaxis=dict(
        title=dict(
            text='Total Sold in USD ($)',
            font=dict(size=26, family='Arial', color='black')
        ),
        tickprefix='$',
        separatethousands=True,
        tickfont=dict(size=26, family='Arial', color='black')
    ),
    legend=dict(
        title=dict(
            text='Legend',
            font=dict(size=26, family='Arial', color='black')
        ),
        font=dict(size=14, family='Arial', color='black')
    ),
    plot_bgcolor="#f1d2b6",
    paper_bgcolor="#f1d2b6"
)

# Show the plot
fig.show()
2nd Graph
# Define the top 15 prize data
lotto_top15_data = pd.DataFrame({
    'Rank': [1, 2, 3, 4, 5, 6, 7, 8, 9, 10, 11, 12, 13, 14, 15],
    'Date': ['Nov 7, 2022', 'Oct 11, 2023', 'Aug 8, 2023', 'Jan 13, 2016', 'Oct 23, 2018',
             'Jan 13, 2023', 'Jul 29, 2022', 'Apr 7, 2024', 'Mar 26, 2024', 'Jul 19, 2023',
             'Jan 22, 2021', 'Jan 1, 2024', 'Sep 10, 2024', 'Mar 27, 2019', 'Aug 23, 2017'],
    'Game': ['Powerball', 'Powerball', 'Mega Millions', 'Powerball', 'Mega Millions',
             'Mega Millions', 'Mega Millions', 'Powerball', 'Mega Millions', 'Powerball',
             'Mega Millions', 'Powerball', 'Mega Millions', 'Powerball', 'Powerball'],
    'Jackpot': [2040, 1765, 1602, 1586, 1537, 1350, 1337, 1326, 1130, 1080, 1050, 842, 810, 768, 759],  # Prize in millions
    'Cash Value': [997.6, 774.1, 794.2, 983.5, 877.8, 724.6, 780.5, 621, 537.5, 558.1, 776.6, 425.2, 409.3, 477, 480.5]
})

# Convert dates to datetime format
lotto_top15_data['Date'] = pd.to_datetime(lotto_top15_data['Date'])

# Filter dates between 2020 and 2025
highlighted_dates = lotto_top15_data[(lotto_top15_data['Date'] >= '2020-01-01') & (lotto_top15_data['Date'] <= '2025-12-31')]

# Identify the top 10 values
daily_lotto_data['color'] = '#2E3192'  # Default color for all points
top_15_indices = daily_lotto_data.nlargest(15, 'Total').index
daily_lotto_data.loc[top_15_indices, 'color'] = '#a6445d'  # Assign special color for top 15 values

# Create the Plotly figure
fig = go.Figure()

# Add the line trace
fig.add_trace(go.Scatter(
    x=daily_lotto_data['day'],
    y=daily_lotto_data['Total'],
    mode='lines+markers',
    marker=dict(
        color=daily_lotto_data['color'],
        size=2
    ),
    line=dict(
        color='#142f40',  # Line color
        width=1
    ),
    name='Price per Item',
    hovertemplate='<b>Date:</b> %{x|%Y-%m-%d}<br><b>Total Price:</b> %{y}<extra></extra>',
    showlegend=False
))

# Add highlighted jackpot dates with prize pool cost
for _, row in highlighted_dates.iterrows():
    jackpot_label = f"{row['Jackpot'] / 1000:.1f}B" if row['Jackpot'] >= 1000 else f"{row['Jackpot']}M"  # Format B for billions
    fig.add_trace(go.Scatter(
        x=[row['Date']],
        y=[daily_lotto_data[daily_lotto_data['day'] == row['Date']]['Total'].values[0]] if row['Date'] in daily_lotto_data['day'].values else [None],
        mode='markers+text',
        text=f"<b>{row['Date'].strftime('%Y-%m-%d')}: {jackpot_label}</b>",
        textposition="top center",
        textfont=dict(
            color='#ED1E79',  # Text color for jackpot markers
            size=14  # Smaller text size for annotations
        ),
        name=f"{row['Game']} - {row['Date'].strftime('%Y-%m-%d')} (Jackpot: {jackpot_label})",
        marker=dict(size=10, color='#ED1E79')  # Larger markers for jackpot dates
    ))

# Adjust marker size for top 15 points that are not jackpot dates
for idx in top_15_indices:
    if daily_lotto_data.loc[idx, 'day'] not in highlighted_dates['Date'].values:
        fig.add_trace(go.Scatter(
            x=[daily_lotto_data.loc[idx, 'day']],
            y=[daily_lotto_data.loc[idx, 'Total']],
            mode='markers',
            marker=dict(
                size=8,
                color='#a71f13'
            ),
            name='Top 15 Non-Jackpot',
            hoverinfo='skip',  # Disable hover info for these markers
            showlegend=False  # Hide legend for these points
        ))

# Update layout
fig.update_layout(
    title="Sales Trend for Lotto with Highlighted Jackpot Dates (2020–2025)",
    title_font=dict(size=28, family="Arial", color="black"),
    xaxis=dict(
        title='Date',
        tickformat='%Y-%m',
        dtick="M3",
        tickangle=45,
        tickfont=dict(size=26, family='Arial', color='black')
    ),
    yaxis=dict(
        title='Total Sold',
        title_font=dict(size=26, family="Arial", color="black"),
        tickfont=dict(size=26, family='Arial', color='black')
    ),
    legend=dict(
        title=dict(
            text="Legend",
            font=dict(size=26, family="Arial", color="black")
        ),
        font=dict(size=20, family="Arial", color="black"),
        x=0.75,
        y=1.2,
        bgcolor="#ffffff",
        bordercolor="#000000",
        borderwidth=1
    ),
    plot_bgcolor="#ffebf0",
    paper_bgcolor="#ffebf0",
    height=900
)

# Show the plot
fig.show()
Data behind the Luck, Ambition, and a Billion-Dollar Dream: Lottery was originally published in Towards Data Science on Medium, where people are continuing the conversation by highlighting and responding to this story.
from Datascience in Towards Data Science on Medium https://ift.tt/g3LmX7z
via IFTTT


