Harnessing Polars and Geopandas to Generate Millions of Transects in Seconds
Making the bears play nice
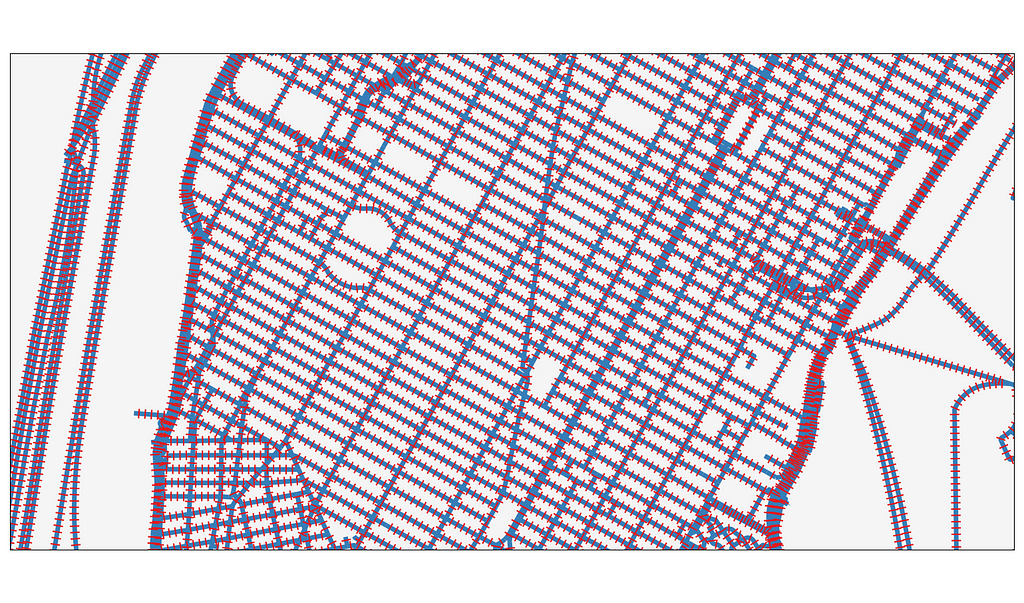
The Problem:
I needed to generate a transect every 10 feet across every street in New York City, and I had to do it in a New York Minute. The Generate Transects Along Lines tool built into ArcGIS Pro was going to take multiple days to run, so I had to come up with something at least slightly faster.
To solve this problem, I turned to two of my favorite bears, Geopandas and Polars, to use spatial algorithms and a dash of linear algebra to make 4.2 million transects in around 60 seconds.
Why Transects? In this circumstance, I would go on to use these transects to split up roadway lines into equal intervals for storm damage analysis. It is easier to split a line with another line than it is to split a line with a point, since you can guarantee they will intersect and you don’t have to worry about floating point imprecision. But, transects are super-useful for lots of application, such as sampling river depth profiles and creating a regular grid from a curvilinear line.
The Process:
First, I generated points along each line at 10 ft intervals using Geopandas built-in interpolate function. Once I had those points, I swapped them over to Polars, where I was able to take advantage of Polars’ built-in parallelism and intuitive syntax to quickly convert those points into (roughly) perpendicular transects. Finally, I put the transects into a GeoDataFrame for further spatial fun.
It may sound annoying to go back and forth between Geopandas and Polars, but each has its own advantages — GeoPandas has spatial operations, and Polars is wicked fast and I strongly prefer the syntax. The Polars .to_pandas() and .from_pandas() methods work so well that I barely notice the switch. While putting a panda bear and a polar bear into the same zoo enclosure may have disasterous consequences, in this circumstance they are able to play together quite nicely.
Requirements: This code was developed in a mamba environment with the following packages and has not been tested with other versions
geopandas==1.0.1
pandas==2.2.3
polars==1.18.0
Shapely==2.0.6
The data used in this article comes from NYC Open Data, and is available for download here. In this example, I am using the December 24, 2024 release of the NYC Street Centerlines.
Step 1: Generate points along lines every 10 feet with Geopandas
In order to create transects along each line, we first need to find the centerpoint of each transect. Since we want a transect every 10 ft, we will grab a point every 10 ft along every linestring in the dataset. We are also grab an additional point slightly offset from each transect point; this will allow us to findthe orientation needed to make the transect perpendicular to the original line. Before we get to all that, we need to load the data.
import geopandas as gpd

ROADS_LOC = r"NYC Street Centerline\NYC_Roads.shp"
ROADS_GDF = (
   gpd.read_file(ROADS_LOC)
      .reset_index(names="unique_id")
      .to_crs("epsg:6539")
)
In addition to loading the data, we also assign a unique_id to each road based on its index, and ensure the GeoDataFrame is in a projected coordinate system with feet as its base unit — since these road lines are in New York City, we use New York — Long Island State Plane as the coordinate reference system. The unique_id column will allow us to link our generated transects back to the original road segment.
Once the data has been loaded, we need to sample along every line at 10 ft intervals. We can accomplish this using the GeoPandas interpolate function, as below:
import pandas as pd
from typing import Tuple, Union


def interpolate_points(
    gdf: gpd.GeoDataFrame, distance: Union[float, int], is_transect: bool
) -> Tuple[gpd.GeoDataFrame, gpd.GeoDataFrame]:
    gdf = gdf.loc[gdf.length > distance]

    new_points = gdf.interpolate(distance)

    new_gdf = gpd.GeoDataFrame(
        geometry=new_points,
        data={
            "unique_id": gdf["unique_id"],
            "distance": distance,
            "is_transect": is_transect,
        },
        crs=gdf.crs,
    )

    return gdf, new_gdf

def get_road_points(roads: gpd.GeoDataFrame, segment_length: int)
-> gpd.GeoDataFrame:
    working_roads = roads.copy()
    road_points = []
    for segment_distance in range(
        segment_length, int(roads.length.max()) + 1, segment_length
    ):
        working_roads, new_gdf = interpolate_points(
            working_roads, segment_distance - 1, False
        )
        road_points.append(new_gdf)

        working_roads, new_gdf = interpolate_points(
            working_roads, segment_distance, True
        )
        road_points.append(new_gdf)

    return pd.concat(road_points, ignore_index=True)
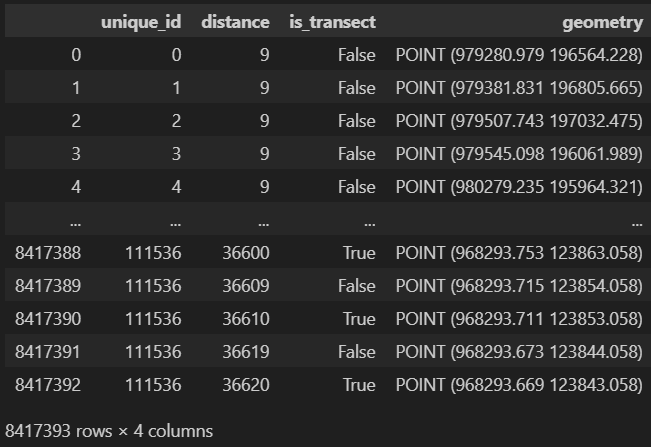
The function get_road_points() loops through all the segment distances in the roads GeoDataFrame, given a segment length s. Every iteration i, we select only roads which are longer than s * i. We sample a point along each line at s * i distance. These points will be the centerpoints of our new transects. Since we want to orient our new transects perpendicular to the line from which they spawned, we also sample a point at distance (s * i) -1. This gives us the approximate orientation of the line, which we will use later on when constructing the transects. As this method outputs a GeoSeries, we build a new GeoDataFrame, keeping the distance of the point along the line, whether the point will be used as a transect, and our previously created unique_id column. Finally, we concatenate all these GeoDataframes together, giving us something that looks like this:
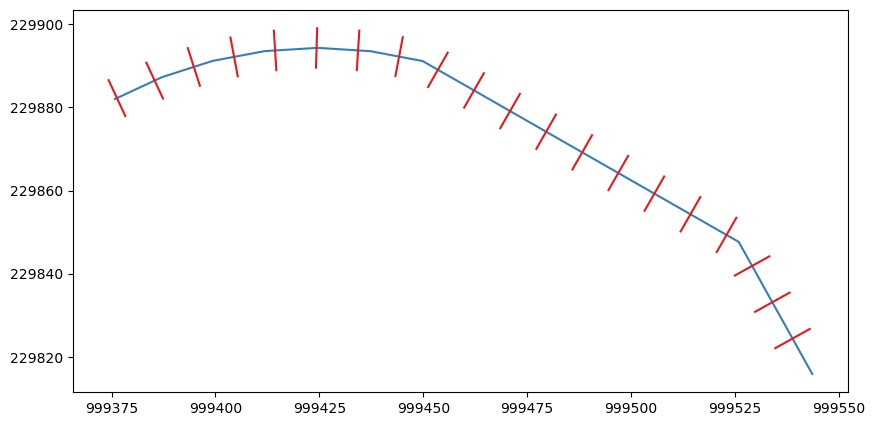
Lets try it out with our roads dataset and see if it works:
import matplotlib.pyplot as plt

points_10ft = get_road_points(ROADS_GDF, 10)
fig, ax = plt.subplots(figsize=(10, 12))

ROADS_GDF.loc[ROADS_GDF['unique_id'] == 100].plot(ax=ax, color='blue')
points_10ft.loc[(points_10ft['unique_id'] == 100) &
                (points_10ft['is_transect'])].plot(ax=ax, color='red')

Step 2: Use Polars and rotation matrices to turn those points into transects
Now that we have the points we need, we can use Polar’s from_pandas() function to convert our GeoDataFrame to Polars. Before we do that, we want to save the information from the geometry column — our x and y locations — and drop the geometry column.
import polars as pl

def roads_to_polars(road_points: gpd.GeoDataFrame) -> pl.DataFrame:
    road_points.loc[:, "x"] = road_points.geometry.x
    road_points.loc[:, "y"] = road_points.geometry.y
    pl_points = pl.from_pandas(road_points.drop("geometry", axis=1))
    return pl_points
Finally, we have everything we need to construct our transects. In essence, all we have to do is find the angle of each transect, construct a transect of the requested length, and rotate and translate the transect so it is properly positioned in space. That may sound like a doozy, but if we break it down into steps we are not doing anything overly complicated.
- Align each transect point with the point prior to it. This will allow us to orient each transect perpendicular to the original line by pivoting around the prior point. In fact, lets call the prior point the ‘pivot point’ to make this more clear.
- Translate the transect point/pivot point pair so that the pivot point is at 0, 0. By doing this, we can easily rotate the transect point so that it sits at y = 0.
- Rotate the transect point so that it sits at y = 0. By doing this, the math to construct new points which will form our transect becomes simple addition.
- Construct new points above and below the rotated transect point so that we have a new line with distance equal to line length.
- Rotate the new points back to the original orientation relative to the pivot point.
- Translate the new points so that the pivot point returns to its original position.
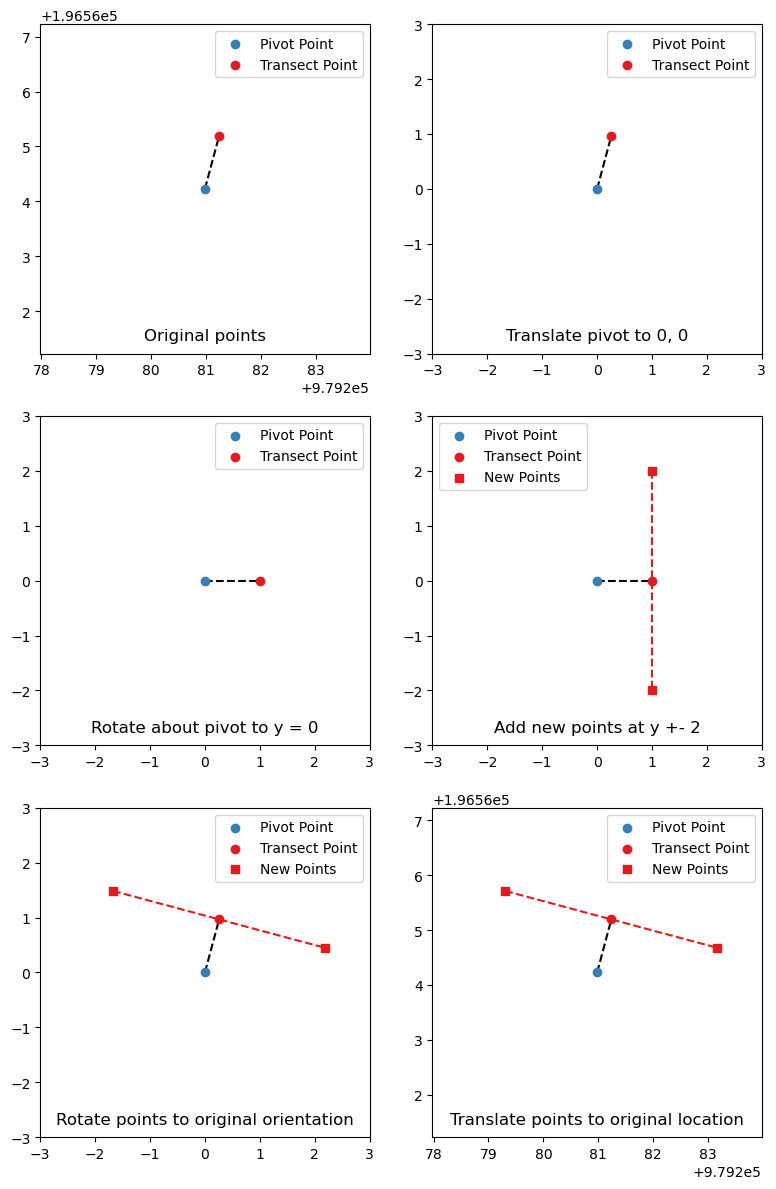
Lets take a look at the code to do this. On my old laptop this code takes about 3 seconds to generate 4.2 million transects.
def make_lines(
  pl_points: pl.DataFrame, line_length: Union[float, int])
  -> pl.DataFrame:
    return (
        pl_points.sort("unique_id", "distance")
        # Pair each transect point with its preceding pivot point
        # over() groups by unique id, and shift(1) moves
        # each column down by 1 row
        .with_columns(
            origin_x=pl.col("x").shift(1).over(pl.col("unique_id")),
            origin_y=pl.col("y").shift(1).over(pl.col("unique_id")),
        )
        # Remove pivot point rows
        .filter(pl.col("is_transect"))
        # Translate each point so the pivot is now (0, 0)
        .with_columns(
            translated_x=pl.col("x") - pl.col("origin_x"),
            translated_y=pl.col("y") - pl.col("origin_y"),
        )
        # Calculate angle theta between translated transect point and x-axis
        .with_columns(theta=pl.arctan2(
            pl.col("translated_y"), pl.col("translated_x")
            )
        )
        # Calculate terms in rotation matrix
        .with_columns(
          theta_cos=pl.col("theta").cos(),
          theta_sin=pl.col("theta").sin()
        )
        # Add y-coordinates above and below x axis so we have a line of desired
        # length. Since we know that x = 1 (the distance between the transect
        # and pivot points), we don't have to explicitly set that term.
        .with_columns(
            new_y1=-line_length / 2,
            new_y2=line_length / 2,
        )
        # Apply rotation matrix to points (1, new_y1) and (1, new_y2)
        # and translate back to the original location
        .with_columns(
            new_x1=pl.col("theta_cos")
            - (pl.col("new_y1") * pl.col("theta_sin"))
            + pl.col("origin_x"),
            new_y1=pl.col("theta_sin")
            + (pl.col("new_y1") * pl.col("theta_cos"))
            + pl.col("origin_y"),
            new_x2=pl.col("theta_cos")
            - (pl.col("new_y2") * pl.col("theta_sin"))
            + pl.col("origin_x"),
            new_y2=pl.col("theta_sin")
            + (pl.col("new_y2") * pl.col("theta_cos"))
            + pl.col("origin_y"),
        )
        # Construct a Well-Known Text representation of the transects
        # for easy conversion to GeoPandas
        .with_columns(
            wkt=pl.concat_str(
                pl.lit("LINESTRING ("),
                pl.col("new_x1"),
                pl.col("new_y1"),
                pl.lit(","),
                pl.col("new_x2"),
                pl.col("new_y2"),
                pl.lit(")"),
                separator=" ",
            )
        )
    )
How are we actually accomplishing the rotation?
We rotate the transect point about the origin using a rotation matrix. This is a 2x2 matrix which, when applied to a point in a 2d-plane, rotates the point θ degrees around the origin (0, 0).

To use it, all we need to do is calculate θ, then multiply the point (x, y) and the rotation matrix. This gives us the formula new_x = x*cos(θ)-y*sin(θ), new_y = x*sin(θ) + y*cos(θ). We calculate the result using this code:
.with_columns(
      new_x1=pl.col("theta_cos")
      - (pl.col("new_y1") * pl.col("theta_sin"))
      + pl.col("origin_x"),
      new_y1=pl.col("theta_sin")
      + (pl.col("new_y1") * pl.col("theta_cos"))
      + pl.col("origin_y"),
      new_x2=pl.col("theta_cos")
      - (pl.col("new_y2") * pl.col("theta_sin"))
      + pl.col("origin_x"),
      new_y2=pl.col("theta_sin")
      + (pl.col("new_y2") * pl.col("theta_cos"))
      + pl.col("origin_y"),
  )
We are able to simplify the calculation, since we know that x is always 1 for our points (x, y). Instead of calculating x*cos(θ)-y*sin(θ) to find the x value of a rotated point, we can just do cos(θ)-y*sin(θ), saving us a little bit of computation. Of course, this won’t work if your pivot point and transect point are not 1 unit apart, but for our purposes it is just fine. Once we have the rotation completed, all we have to do is translate the newly rotated points by the distance between the pivot point and (0,0), and boom, we are done. If you are interested in learning more about linear algebra and affine transformations, I highly reccomend the 3Blue1Brown series Essence of Linear Algebra.
Using the above functions, we can take our GeoDataFrame, convert it to Polars, and calculate new transects like so:
points_10ft_pl = roads_to_polars(points_10ft)
transects_10ft = make_lines(points_10ft_pl, 10)
transects_10ft.select(['unique_id', 'wkt'])
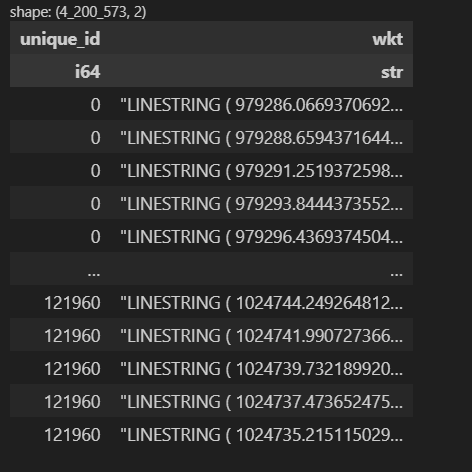
Step 3: Convert the transects back to Geopandas
Finally! We have the geometric coordinates of the transects we need, but we want them in a GeoDataFrame so we can go back to the comfort of GIS operations. Since we constructed our new transects as WKT Linestrings at the end of the make_lines() function, the code to do so is simple:
transects_gdf = gpd.GeoDataFrame(
    crs=ROADS_GDF.crs,
    data={"unique_id": transects_10ft.select("unique_id").to_series()},
    geometry=gpd.GeoSeries.from_wkt(
        transects_10ft.select("wkt").to_series().to_list()
    ),
)
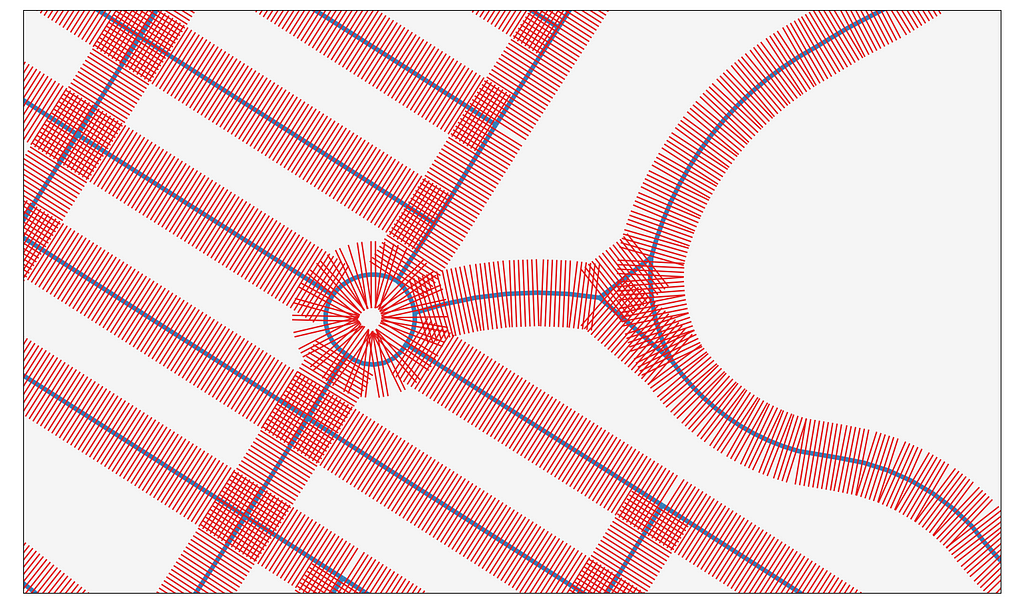
And thats it! We now have a GeoDataFrame with 4.2 million transects, each linked to their original roadway using the unique_id column.
Lets check out our new geometry:
ROAD_ID = 98237
fig, ax = plt.subplots(figsize=(10, 12))
ROADS_GDF.loc[ROADS_GDF['unique_id'] == ROAD_ID].plot(ax=ax, color='blue')
transects_gdf.loc[transects_gdf['unique_id'] == ROAD_ID].plot(ax=ax, color='green')
ax.set_aspect("equal")
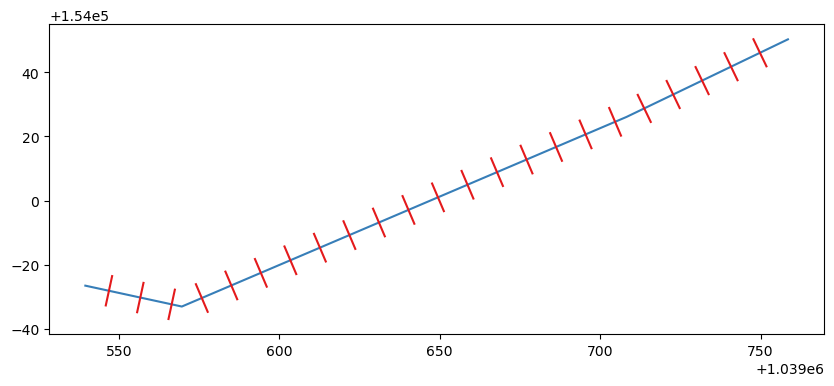
Transects spaced 10ft apart along a pedestrian pathLooks good! We are losing a little bit of precision with the WKT conversion, so there is probably a better way to do that, but it works well enough for me.
Putting it all Together
For your convenience, I have combined the code to generate the transects below. This will only work with data projected to a planar coordinate system, and if you want to use a pivot point that is further than 1 unit from a transect point, you will need to modify the code.
from typing import Tuple, Union

import geopandas as gpd
import pandas as pd
import polars as pl


def interpolate_points(
    gdf: gpd.GeoDataFrame, distance: Union[float, int], is_transect: bool
) -> Tuple[gpd.GeoDataFrame, gpd.GeoDataFrame]:
    gdf = gdf.loc[gdf.length > distance]

    new_points = gdf.interpolate(distance)

    new_gdf = gpd.GeoDataFrame(
        geometry=new_points,
        data={
            "unique_id": gdf["unique_id"],
            "distance": distance,
            "is_transect": is_transect,
        },
        crs=gdf.crs,
    )

    return gdf, new_gdf


def get_road_points(roads: gpd.GeoDataFrame, segment_length: int) -> gpd.GeoDataFrame:
    working_roads = roads.copy()
    road_points = []
    for segment_distance in range(
        segment_length, int(roads.length.max()) + 1, segment_length
    ):
        working_roads, new_gdf = interpolate_points(
            working_roads, segment_distance - 1, False
        )
        road_points.append(new_gdf)

        working_roads, new_gdf = interpolate_points(
            working_roads, segment_distance, True
        )
        road_points.append(new_gdf)

    return pd.concat(road_points, ignore_index=True)


def roads_to_polars(road_points: gpd.GeoDataFrame) -> pl.DataFrame:
    road_points.loc[:, "x"] = road_points.geometry.x
    road_points.loc[:, "y"] = road_points.geometry.y
    pl_points = pl.from_pandas(road_points.drop("geometry", axis=1))
    return pl_points


def make_lines(pl_points: pl.DataFrame, line_length: Union[float, int]) -> pl.DataFrame:
    return (
        pl_points.sort("unique_id", "distance")
        .with_columns(
            origin_x=pl.col("x").shift(1).over(pl.col("unique_id")),
            origin_y=pl.col("y").shift(1).over(pl.col("unique_id")),
        )
        .filter(pl.col("is_transect"))
        .with_columns(
            translated_x=pl.col("x") - pl.col("origin_x"),
            translated_y=pl.col("y") - pl.col("origin_y"),
        )
        .with_columns(theta=pl.arctan2(pl.col("translated_y"), pl.col("translated_x")))
        .with_columns(theta_cos=pl.col("theta").cos(), theta_sin=pl.col("theta").sin())
        .with_columns(
            new_y1=-line_length / 2,
            new_y2=line_length / 2,
        )
        .with_columns(
            new_x1=pl.col("theta_cos")
            - (pl.col("new_y1") * pl.col("theta_sin"))
            + pl.col("origin_x"),
            new_y1=pl.col("theta_sin")
            + (pl.col("new_y1") * pl.col("theta_cos"))
            + pl.col("origin_y"),
            new_x2=pl.col("theta_cos")
            - (pl.col("new_y2") * pl.col("theta_sin"))
            + pl.col("origin_x"),
            new_y2=pl.col("theta_sin")
            + (pl.col("new_y2") * pl.col("theta_cos"))
            + pl.col("origin_y"),
        )
        .with_columns(
            wkt=pl.concat_str(
                pl.lit("LINESTRING ("),
                pl.col("new_x1"),
                pl.col("new_y1"),
                pl.lit(","),
                pl.col("new_x2"),
                pl.col("new_y2"),
                pl.lit(")"),
                separator=" ",
            )
        )
    )
ROADS_LOC = r"NYC Street Centerline\NYC_Roads.shp"
ROADS_GDF = gpd.read_file(ROADS_LOC).reset_index(names="unique_id").to_crs("epsg:6539")

points_10ft = get_road_points(roads=ROADS_GDF, segment_length=10)
points_10ft_pl = roads_to_polars(road_points=points_10ft)
transects_10ft = make_lines(pl_points=points_10ft_pl, line_length=10)
transects_gdf = gpd.GeoDataFrame(
    crs=ROADS_GDF.crs,
    data={"unique_id": transects_10ft.select("unique_id").to_series()},
    geometry=gpd.GeoSeries.from_wkt(transects_10ft.select("wkt").to_series().to_list()),
)
Thanks for reading! There are probably a lot more ways this code could be optimized or made more flexible, but it solved a huge problem for me and cut down compute time from days to seconds. With a little bit of theory and knowing when to use what tool, problems that previously seem insurmountable become shockingly easy. It only took me about 30 minutes and a little wikipedia linear algebra referesher to write the code for this post, saving me tons of time and, more importantly, protecting me from having to explain to a client why a project was pointlessly delayed. Let me know if this was helpful to you!
Unless otherwise noted, all images are by the author.
Harnessing Polars and Geopandas to Generate Millions of Transects in Seconds was originally published in Towards Data Science on Medium, where people are continuing the conversation by highlighting and responding to this story.
from Datascience in Towards Data Science on Medium https://ift.tt/hUyiMXp
via IFTTT


